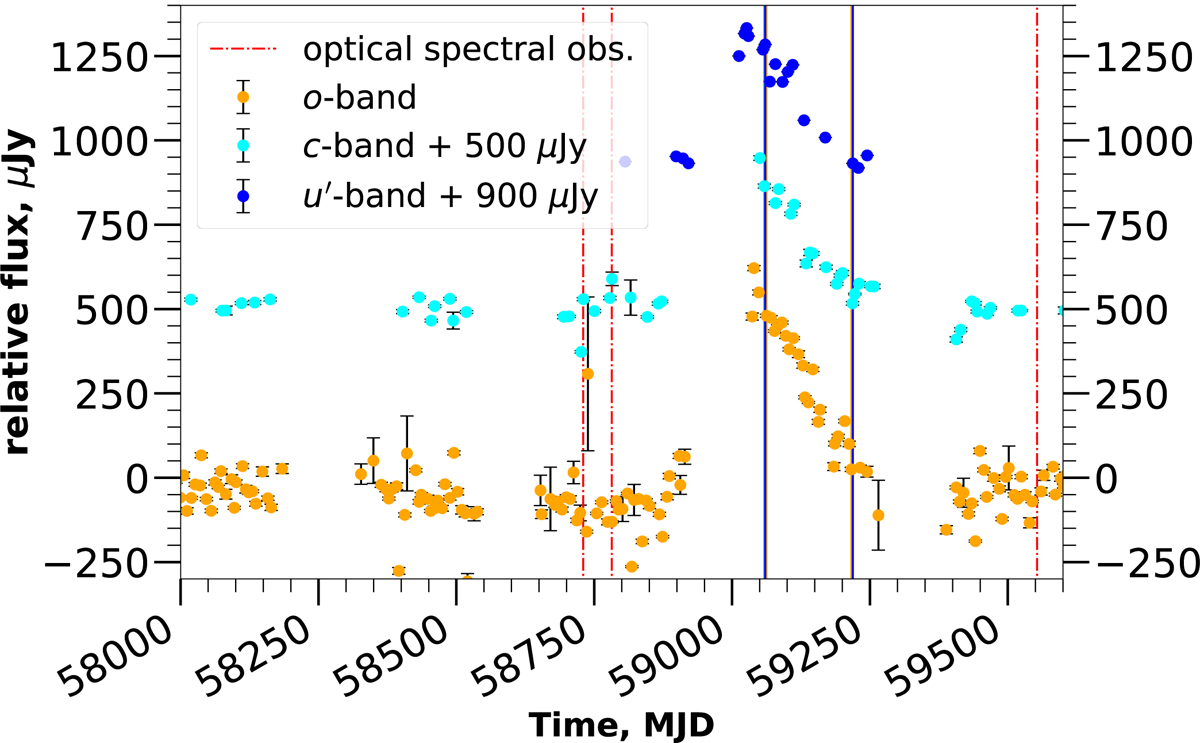
Fig. 9.
Download original image
Outburst as seen in the u′-band (STELLA), c-band (ATLAS) and o-band (ATLAS). The vertical lines with the same colours as the relevant data mark the points taken to calculate and compare the change in flux seen over the decline. The u′- and c-band data have been shifted up for ease of presentation. The dates of the optical spectral observations are shown by the red dot-dashed lines.
Current usage metrics show cumulative count of Article Views (full-text article views including HTML views, PDF and ePub downloads, according to the available data) and Abstracts Views on Vision4Press platform.
Data correspond to usage on the plateform after 2015. The current usage metrics is available 48-96 hours after online publication and is updated daily on week days.
Initial download of the metrics may take a while.