Fig. 7.
Download original image
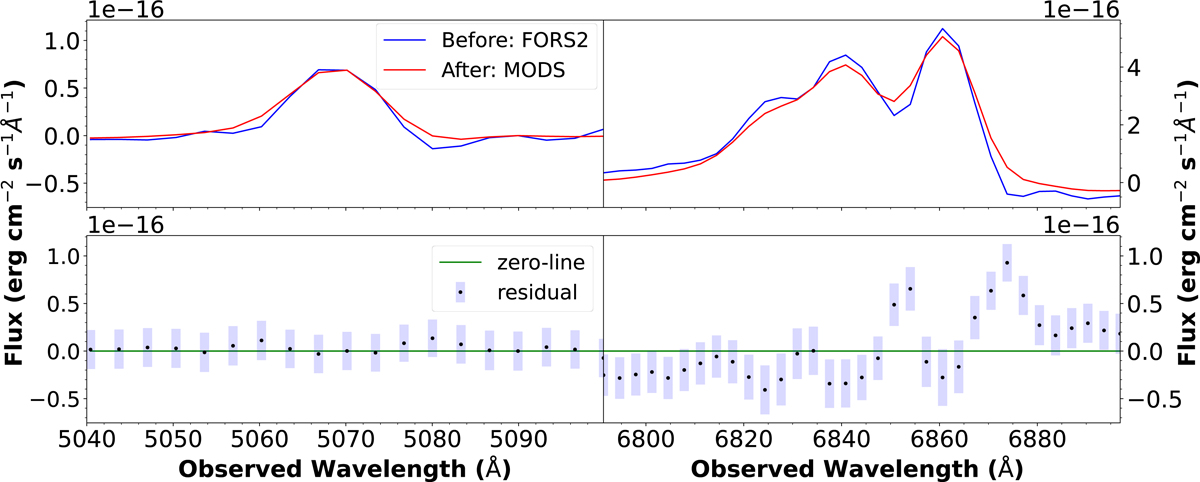
Comparison of spectral observations taken before and after the 2020 outburst, focusing on the Hβ and Hα emission lines. An appropriate value is subtracted to match continuum levels. Top left: close up of the Hβ wavelength range. Spectra were scaled using the average flux of the narrow [OIII] lines. Bottom left: residuals (MODS−FORS2) for Hβ. The combined uncertainties of the two spectra are shown as blue shaded bars for each spectral bin. Top right: a close up of Hα and the NII doublet. Scaling was done by comparing the average flux of the narrow [SII] lines. Bottom right: residuals and combined uncertainties for Hα.
Current usage metrics show cumulative count of Article Views (full-text article views including HTML views, PDF and ePub downloads, according to the available data) and Abstracts Views on Vision4Press platform.
Data correspond to usage on the plateform after 2015. The current usage metrics is available 48-96 hours after online publication and is updated daily on week days.
Initial download of the metrics may take a while.