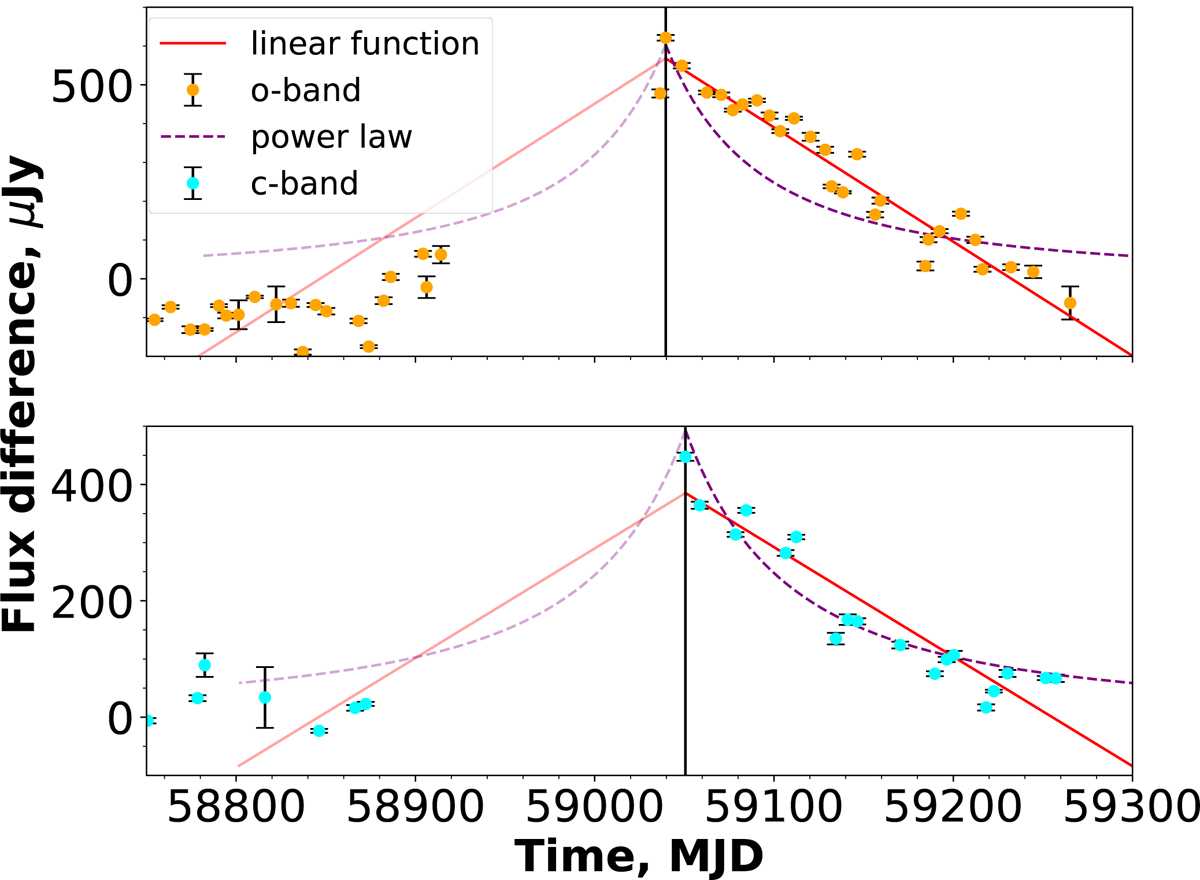
Fig. 6.
Download original image
Straight line and power-law functions fitted to the decline of the 2020 outburst as seen in the orange and cyan filters used by ATLAS. The orange and cyan data points represent observations in each filter respectively. The black vertical lines indicate where the fit starts. These are slightly different for each filter as the fit here was chosen to begin with the brightest data point in each data set. The functions are mirrored for comparison with the outburst rise.
Current usage metrics show cumulative count of Article Views (full-text article views including HTML views, PDF and ePub downloads, according to the available data) and Abstracts Views on Vision4Press platform.
Data correspond to usage on the plateform after 2015. The current usage metrics is available 48-96 hours after online publication and is updated daily on week days.
Initial download of the metrics may take a while.