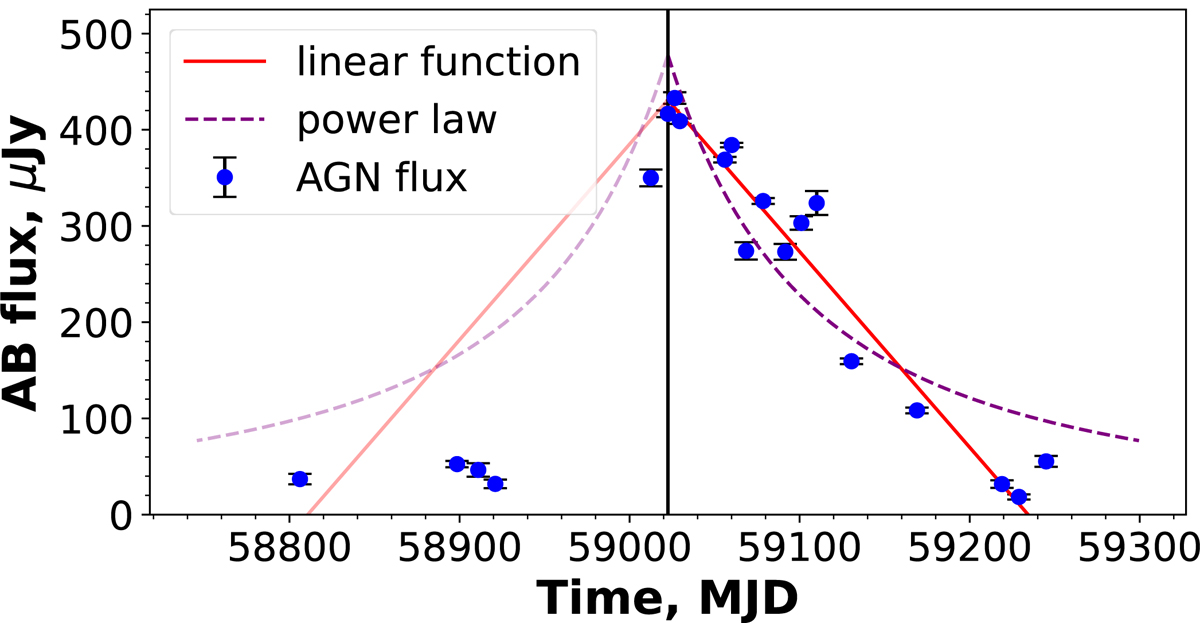
Fig. 5.
Download original image
Straight line and power law functions fitted to the decline of the 2020 outburst as observed in the u′-band. The black vertical line indicates where the fit starts. Only the data from this point onwards are fit as the rise of the outburst was hidden during sunblock. The fainter functions plotted on the left-hand side show the best fit functions mirrored for comparison with the data points before the outburst was observed. This implies an asymmetric outburst with a faster rise than decline.
Current usage metrics show cumulative count of Article Views (full-text article views including HTML views, PDF and ePub downloads, according to the available data) and Abstracts Views on Vision4Press platform.
Data correspond to usage on the plateform after 2015. The current usage metrics is available 48-96 hours after online publication and is updated daily on week days.
Initial download of the metrics may take a while.