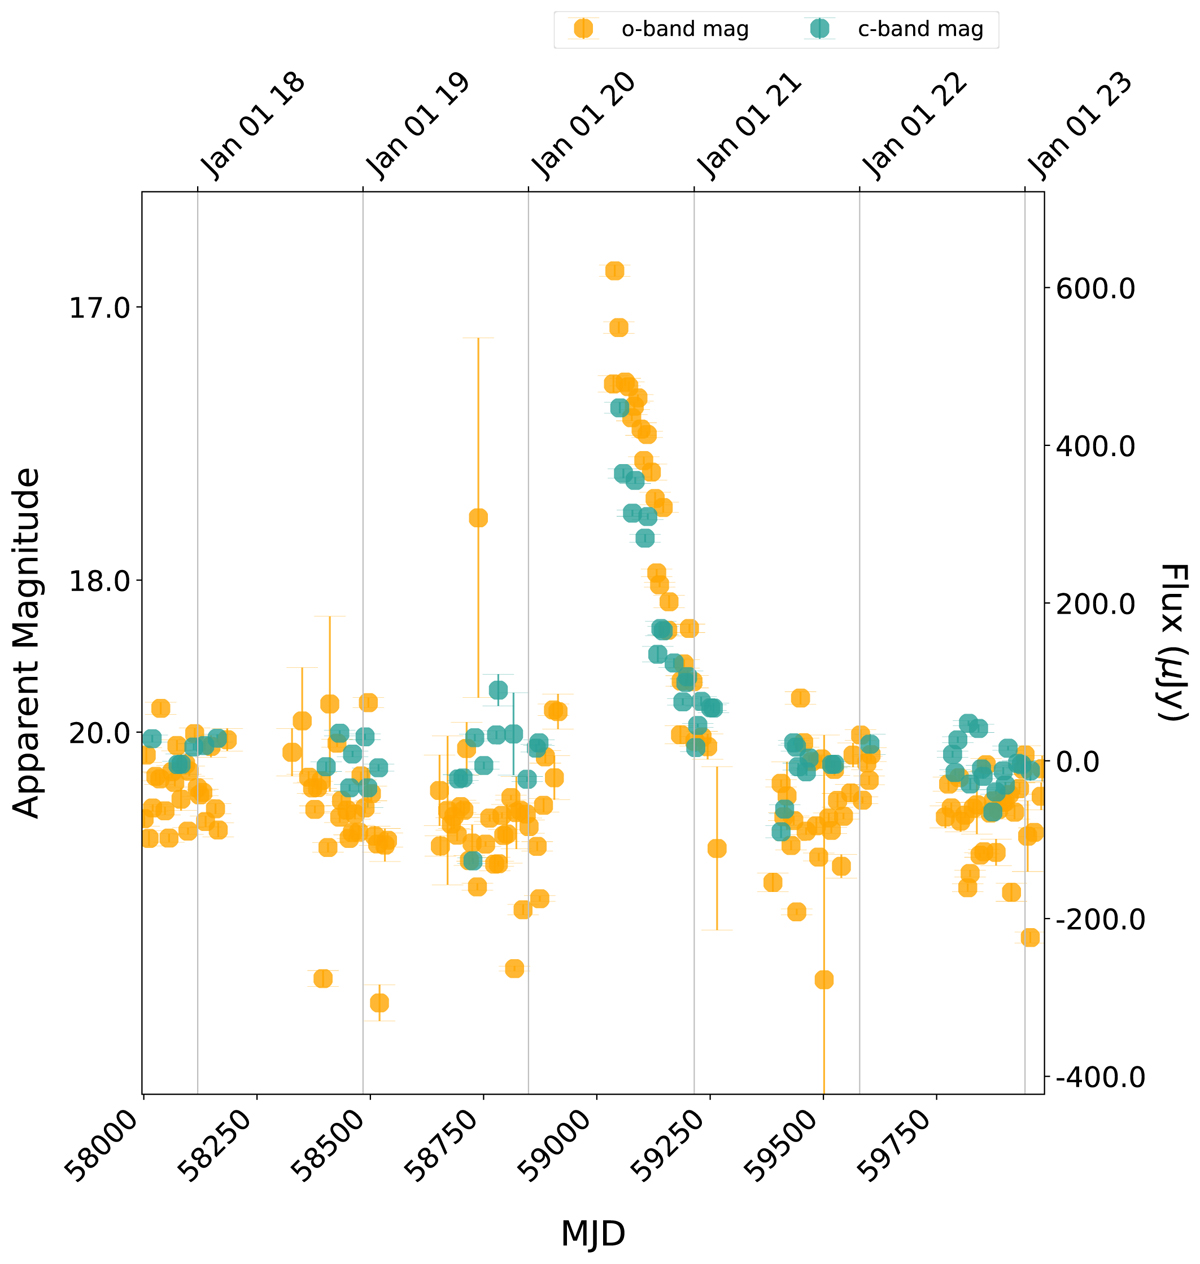
Fig. B.1.
Download original image
Optical light curve downloaded from the ATLAS forced photometry server spanning several years before and after the 2020 outburst. The data were binned to a 7-day cadence. We note that these data show the difference fluxes and magnitudes compared to an ATLAS reference image. The plot indicates that several years before and after the 2020 outburst the AGN remained in a semi-stable faint state.
Current usage metrics show cumulative count of Article Views (full-text article views including HTML views, PDF and ePub downloads, according to the available data) and Abstracts Views on Vision4Press platform.
Data correspond to usage on the plateform after 2015. The current usage metrics is available 48-96 hours after online publication and is updated daily on week days.
Initial download of the metrics may take a while.