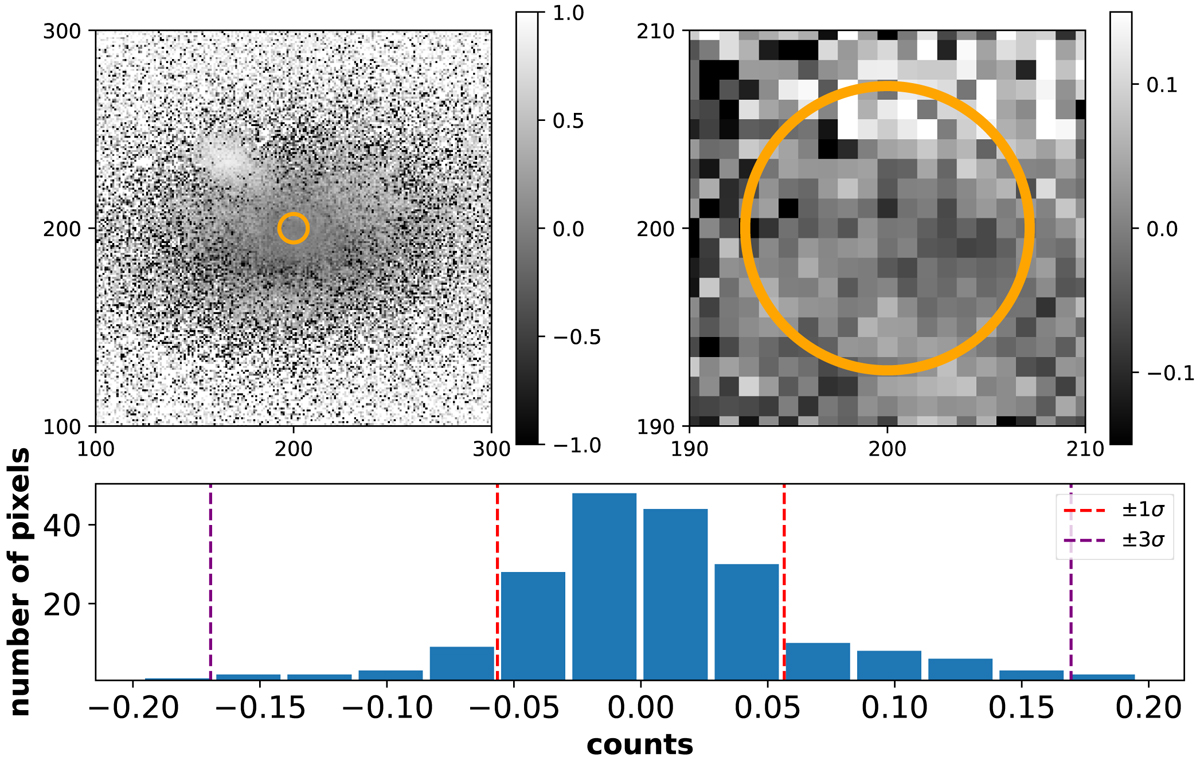
Fig. A.3.

Download original image
Top left: Image created by subtracting the Mrk 1018 (AGN and host galaxy) model from the observed VIMOS image then dividing by the observed image. The x- and y-units are pixels and the spatial resolution is 0.205″ (179 pc) per pixel. The orientation is the same as Fig. A.2. The orange circle encloses 99.7% (3σ) of the total point-like PSF (based on reference star three). The values of the pixels show the fractional differences between the model and the science image (from −1.0 to +1.0, corresponding to a difference of ±100%). Top right: Image zoomed into the central region. The orange circle, again, indicates the 3σ limit of the PSF. The colour scale has been adjusted to a maximum of +0.15 and a minimum of −0.15 (±15%). Bottom: Distribution of the counts for pixels that fall within the 3σ limit of the PSF. The vertical red and purple lines indicate the ±1σ and ±3σ limits of the count distribution respectively. The 1σ level corresponds to deviations of ±0.06 (±6%).
Current usage metrics show cumulative count of Article Views (full-text article views including HTML views, PDF and ePub downloads, according to the available data) and Abstracts Views on Vision4Press platform.
Data correspond to usage on the plateform after 2015. The current usage metrics is available 48-96 hours after online publication and is updated daily on week days.
Initial download of the metrics may take a while.


