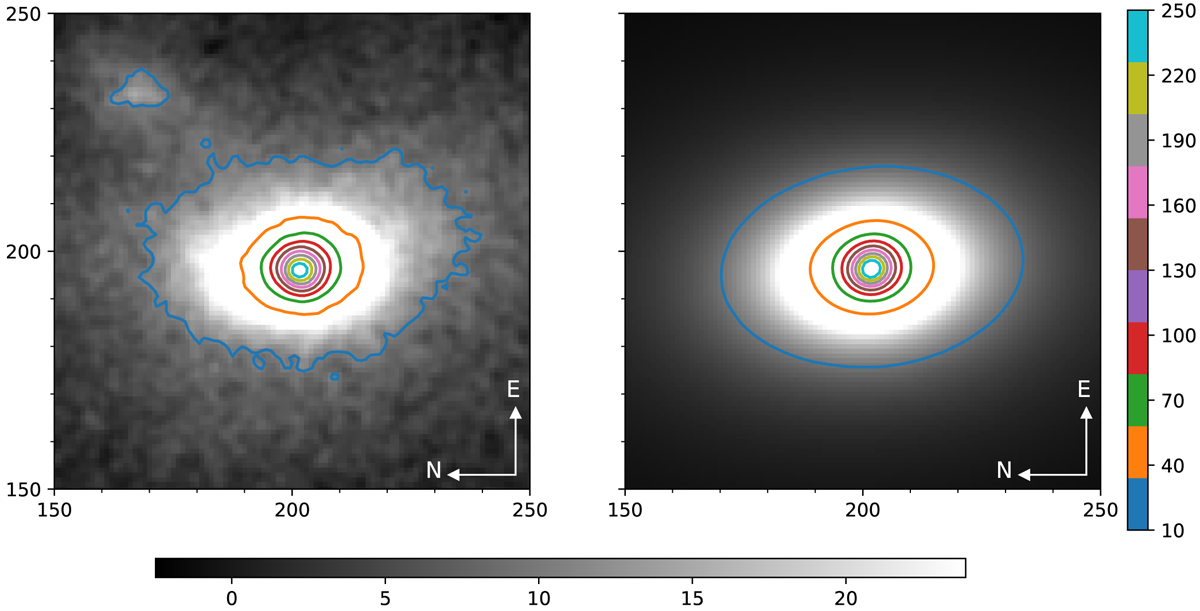
Fig. A.2.
Download original image
Observed and modelled images in units of pixels with a spatial resolution of 0.205″ per pixel, corresponding to 179 pc per pixel. The black and white colour bar indicates the number of counts per pixel and the vertical colour bar shows the values of the contour lines. Left: Observed VIMOS host galaxy image after removal of the best-fit (point-like) AGN model. The different coloured lines are contour lines of constant number of counts. This image is used to determine the count contribution of the host galaxy to the total emission of Mrk 1018. Right: Best-fit model of the host galaxy. Comparison of the inner contours in both images shows that the central region is accurately modelled, even if large residuals remain in the outskirts.
Current usage metrics show cumulative count of Article Views (full-text article views including HTML views, PDF and ePub downloads, according to the available data) and Abstracts Views on Vision4Press platform.
Data correspond to usage on the plateform after 2015. The current usage metrics is available 48-96 hours after online publication and is updated daily on week days.
Initial download of the metrics may take a while.