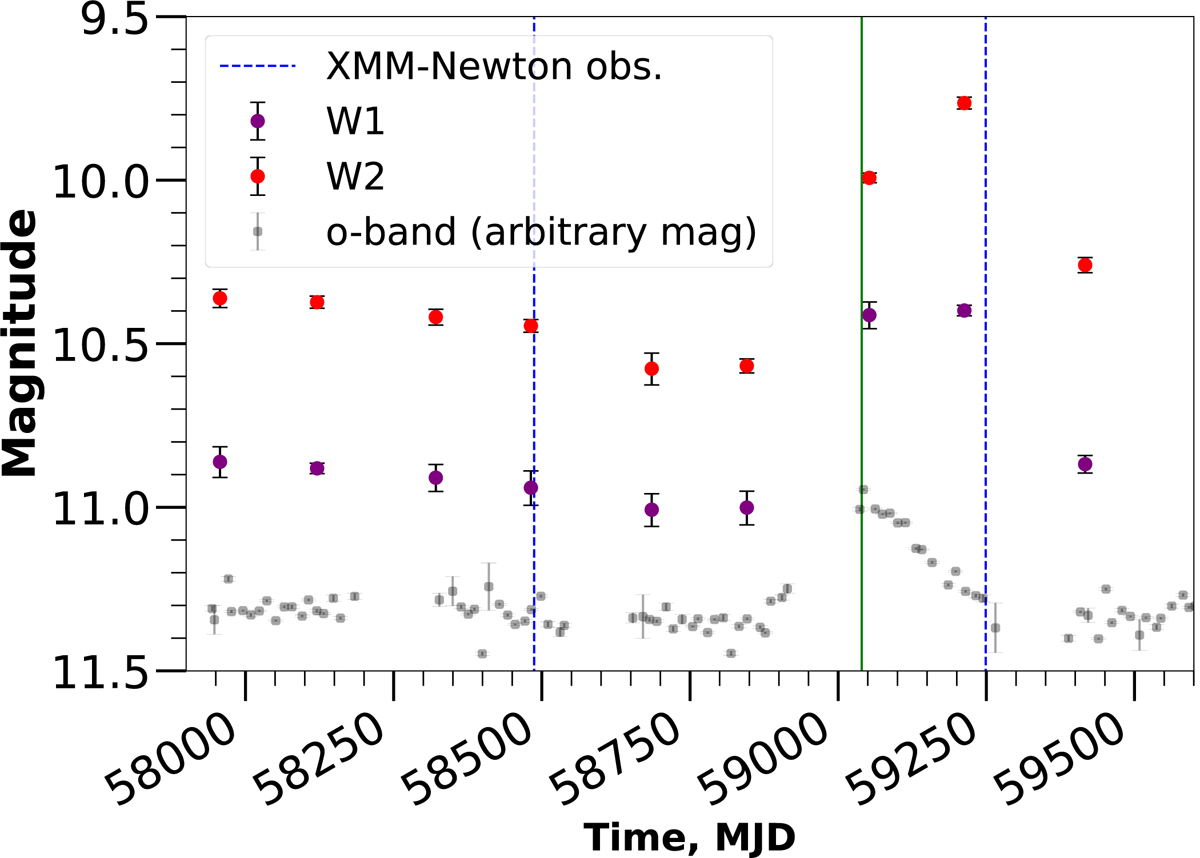
Fig. 10.
Download original image
WISE IR light curve from MJD 57957 to MJD 59417 (Jul. 2017–Jul. 2021). The ATLAS o-band data for the same time period are shown for a visual reference of the rapidness of the IR response. The green line indicates the observed peak of the optical outburst in the ATLAS o-band. The blue dashed lines indicate the dates of the two XMM-Newton observations before and after the outburst.
Current usage metrics show cumulative count of Article Views (full-text article views including HTML views, PDF and ePub downloads, according to the available data) and Abstracts Views on Vision4Press platform.
Data correspond to usage on the plateform after 2015. The current usage metrics is available 48-96 hours after online publication and is updated daily on week days.
Initial download of the metrics may take a while.