Fig. 6
Download original image
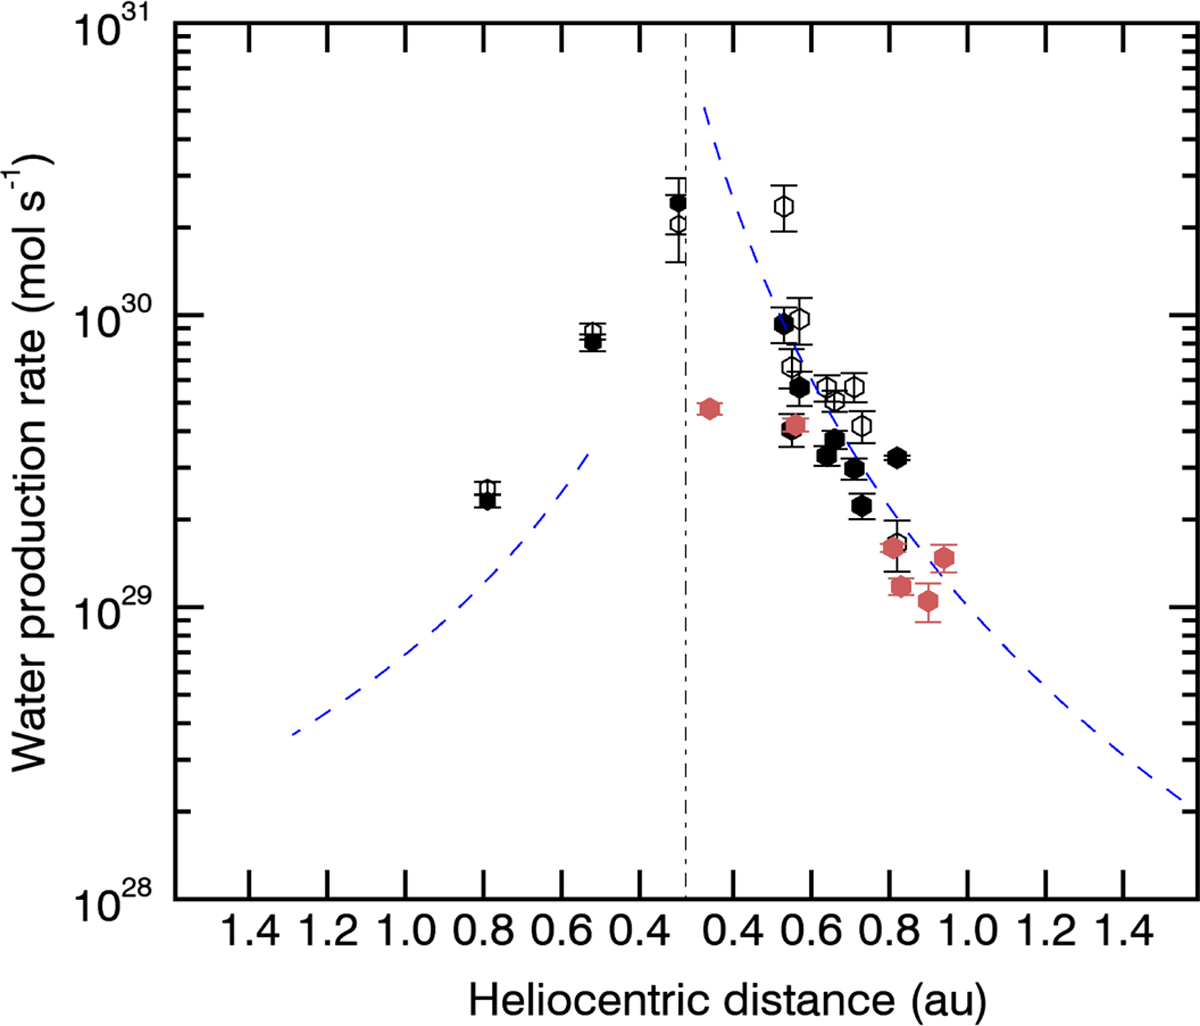
Water production rates of comet C/2020 F3 (NEOWISE). Black dots are values from this work and include the revised value from the Arecibo data: filled and open dots refer to values obtained with the inversion models of Schleicher & A’Hearn (1988) and Despois et al. (1981), respectively. Red dots: values from near-IR observations from Faggi et al. (2021). The dashed blue lines are a fit to the pre- and post-perihelion heliocentric values derived from Ly-a data (Combi et al. 2021).
Current usage metrics show cumulative count of Article Views (full-text article views including HTML views, PDF and ePub downloads, according to the available data) and Abstracts Views on Vision4Press platform.
Data correspond to usage on the plateform after 2015. The current usage metrics is available 48-96 hours after online publication and is updated daily on week days.
Initial download of the metrics may take a while.