Fig. 5
Download original image
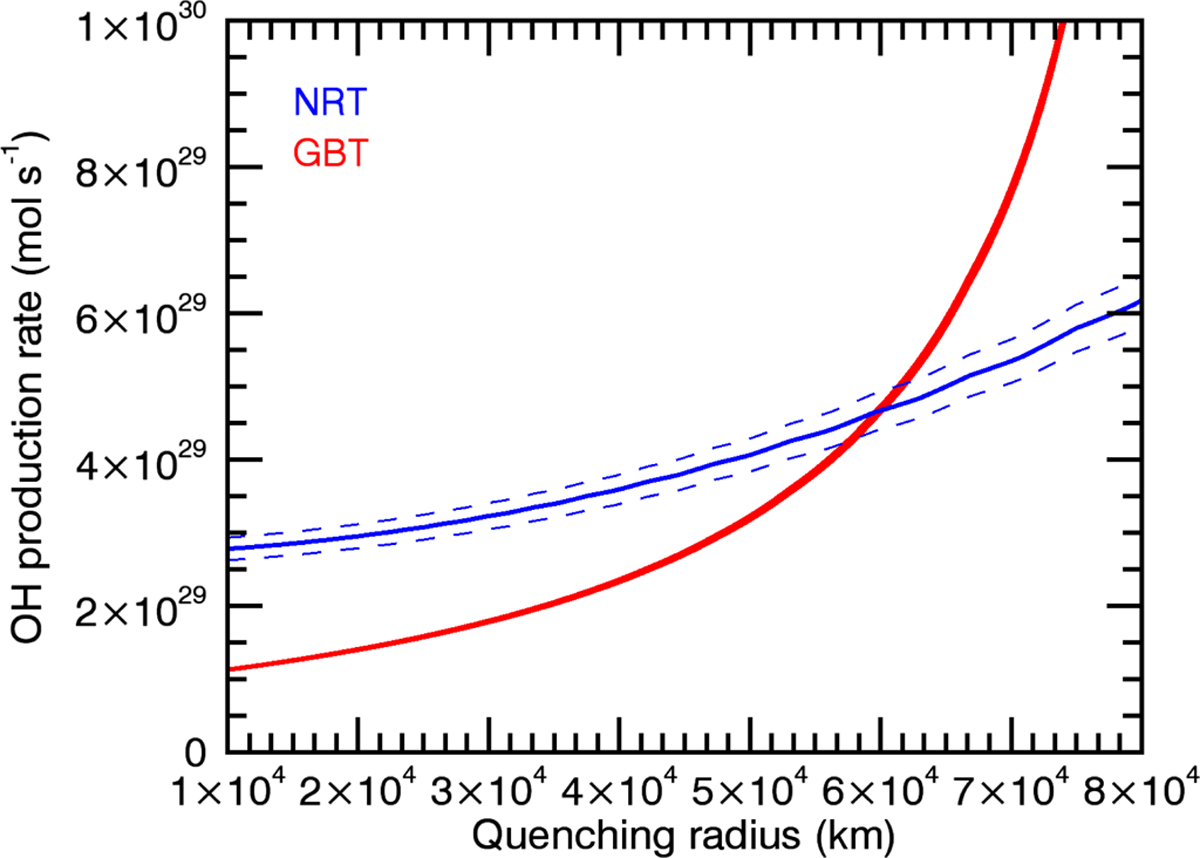
Derived OH production rates from the GBT (red curve) and NRT (blue curves) observations of the OH 1667 MHz line in comet C/2020 F3 (NEOWISE) on 24 July 2020. OH production rates are plotted as a function of the quenching radius. The dashed lines correspond to the ±1σ uncertainty in the line area measured at NRT. Analogous dashed lines for the GBT are indistinguishable from the solid curve due to the high signal-to-noise ratio of the data. The maser inversion is i = 0.20 based on Despois et al. (1981), and the background temperature is Tbg = 3.1 K. The OH spatial distribution is described by the Haser-equivalent model (Combi & Delsemme 1980).
Current usage metrics show cumulative count of Article Views (full-text article views including HTML views, PDF and ePub downloads, according to the available data) and Abstracts Views on Vision4Press platform.
Data correspond to usage on the plateform after 2015. The current usage metrics is available 48-96 hours after online publication and is updated daily on week days.
Initial download of the metrics may take a while.