Fig. 4
Download original image
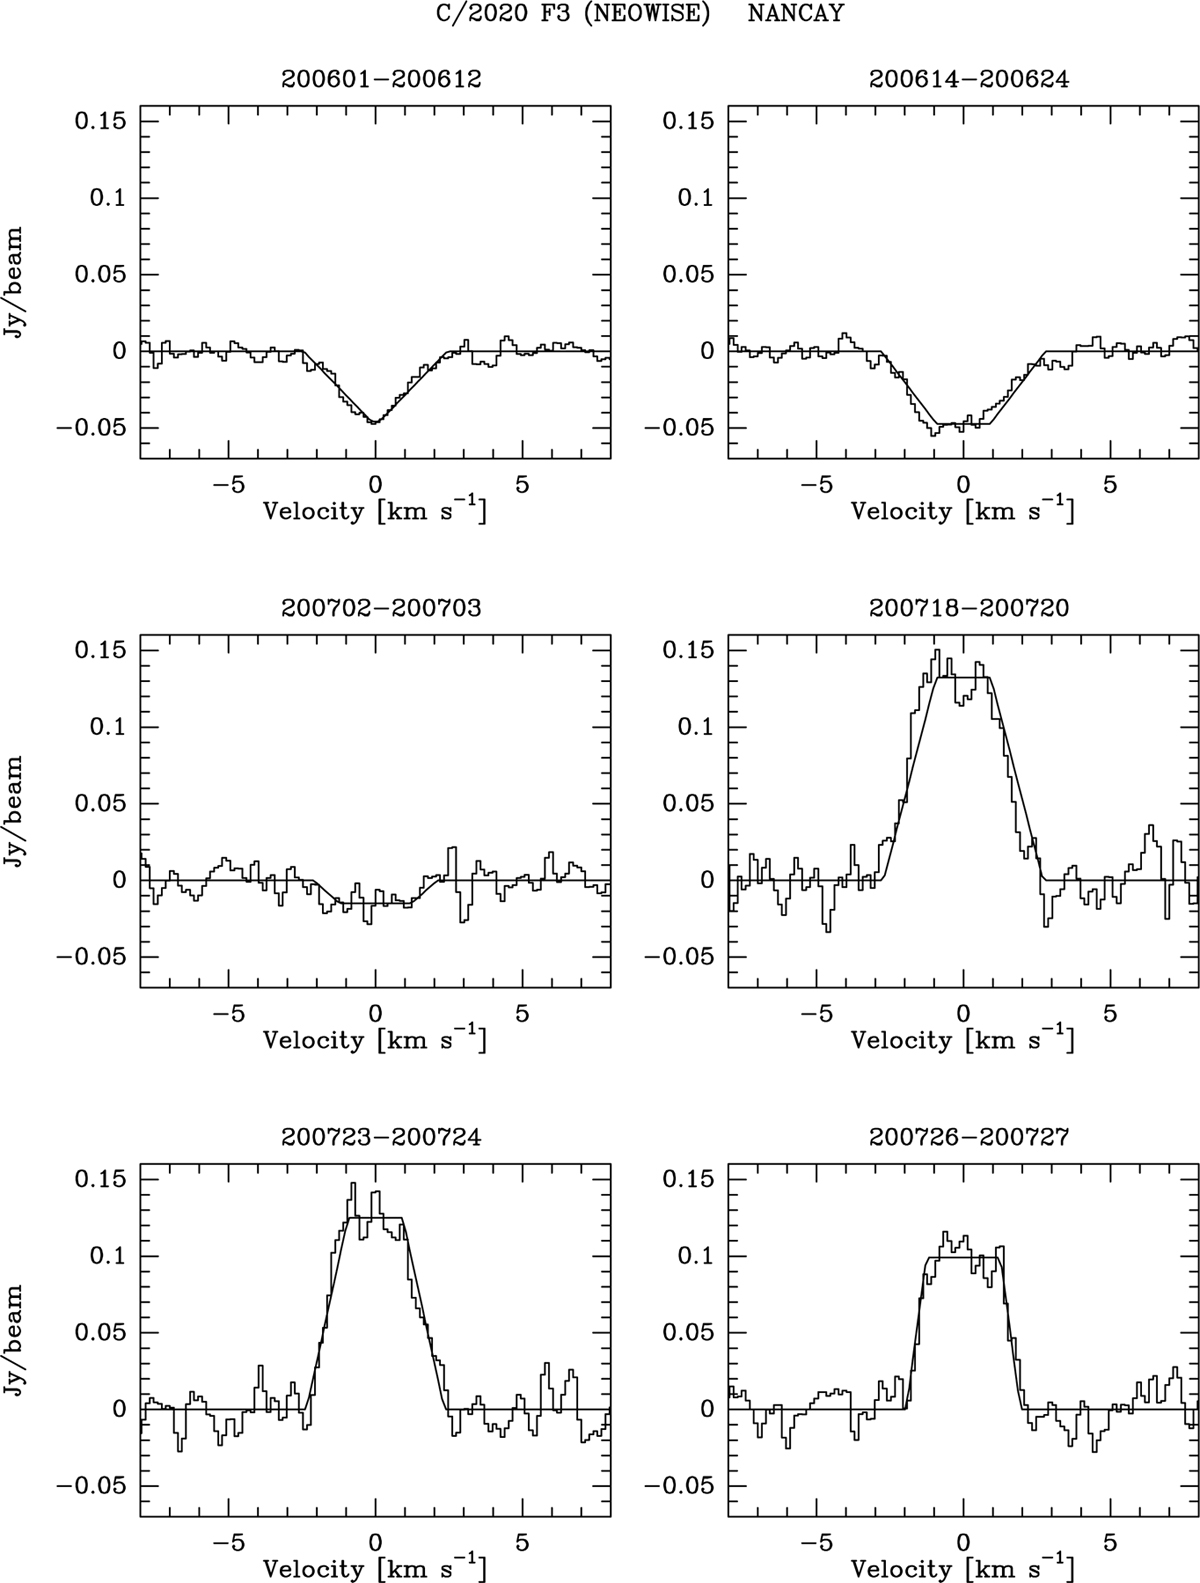
Weighted averages of the OH 1665 and 16 657 MHz lines observed at the NRT, normalized to the intensity of the 1667 MHz (Sect. 2.3). The spectra are integrated over specified periods of time, which are indicated above the plots in yymmdd format. The observations are fitted with trapeziums based on the methodology of Bockelée-Morvan et al. (1990).
Current usage metrics show cumulative count of Article Views (full-text article views including HTML views, PDF and ePub downloads, according to the available data) and Abstracts Views on Vision4Press platform.
Data correspond to usage on the plateform after 2015. The current usage metrics is available 48-96 hours after online publication and is updated daily on week days.
Initial download of the metrics may take a while.