Fig. C.1

Download original image
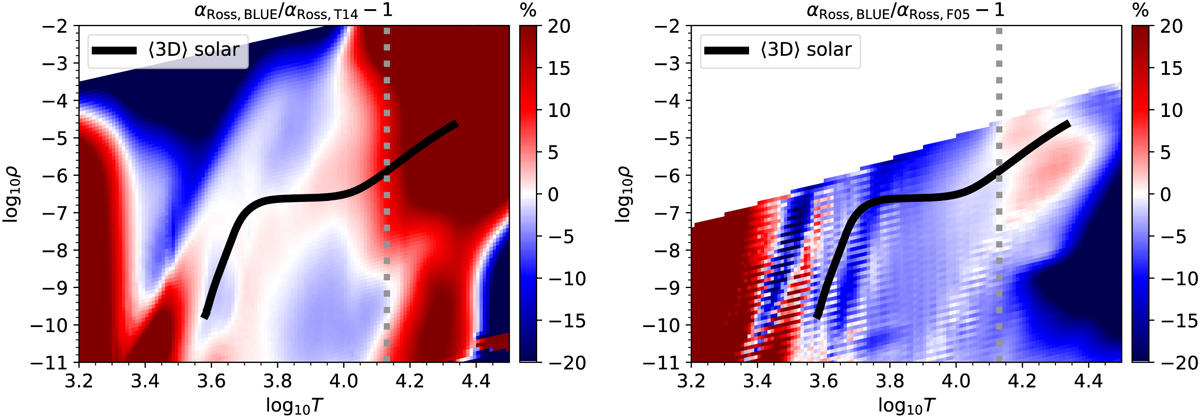
Comparison of Rosseland mean extinction coefficients. Left panel: Relative differences between Rosseland mean extinction coefficients from Blue and those previously adopted in the Stagger code (Hayek et al. 2010; Trampedach et al. 2014), computed via (αRoss, BLUE – αRoss, T14)/αRoss, T14. Blue extinction coefficients are calculated with the internal EOS in Blue (FreeEOS) when log T ≤ 3.9 (log T ≥ 4.1). Results from the two different EOSs are merged in the region where 3.9 < log T < 4.1 (cf. Sect. 2.2.2). The (ρ, T) distribution of the horizontal- and time-averaged reference solar model atmosphere is over-plotted as a thick black line. The grey dotted vertical line crudely marks the temperature limit above which the radiative transfer equation is not solved in the reference solar simulation. Densities and temperatures are in cgs units. Right panel: Relative differences between Rosseland mean extinction coefficients from Blue and those of Ferguson et al. (2005) for the AGSS09 solar composition. The white areas are (ρ, T) combinations not covered by the Ferguson et al. (2005) opacity table.
Current usage metrics show cumulative count of Article Views (full-text article views including HTML views, PDF and ePub downloads, according to the available data) and Abstracts Views on Vision4Press platform.
Data correspond to usage on the plateform after 2015. The current usage metrics is available 48-96 hours after online publication and is updated daily on week days.
Initial download of the metrics may take a while.


