Fig. 15

Download original image
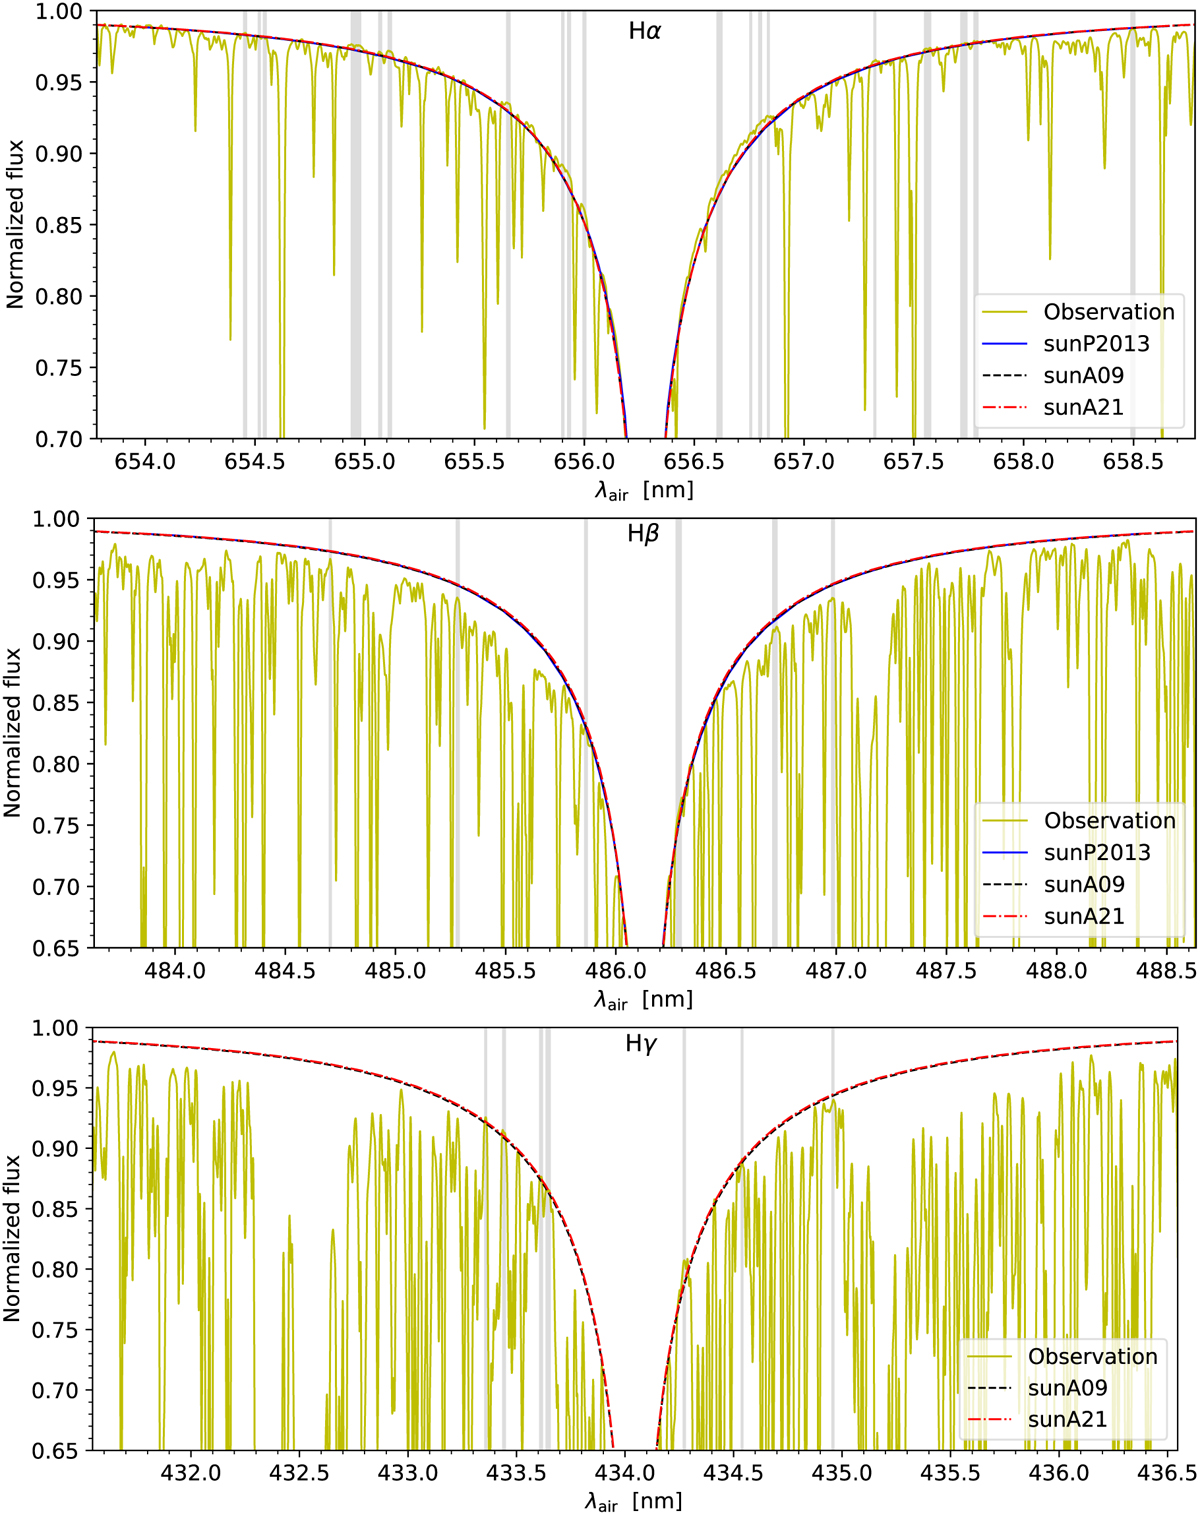
Comparison of the synthesised normalised flux profiles with the Kurucz (2005) normalised solar flux atlas (yellow lines) for the Balmer series Hα (upper panel), Hβ (middle panel), and Hγ (lower panel), where λair is air wavelength. Black dashed and red dash-dotted lines represent synthesised line profiles computed in non-LTE using Balder based on the sunA09 and sunA21 models, respectively. Theoretical results from the sunP2813 model (taken from P2013 Fig. 8) are depicted in blue solid lines. Grey vertical bands indicate the ‘line masks’ derived in Amarsi et al. (2018), which highlights the unblended wavelength sections. Only the wings are shown in the figure because line cores, which are formed in the chromosphere, are of no relevance in this study.
Current usage metrics show cumulative count of Article Views (full-text article views including HTML views, PDF and ePub downloads, according to the available data) and Abstracts Views on Vision4Press platform.
Data correspond to usage on the plateform after 2015. The current usage metrics is available 48-96 hours after online publication and is updated daily on week days.
Initial download of the metrics may take a while.


