Fig. 14

Download original image
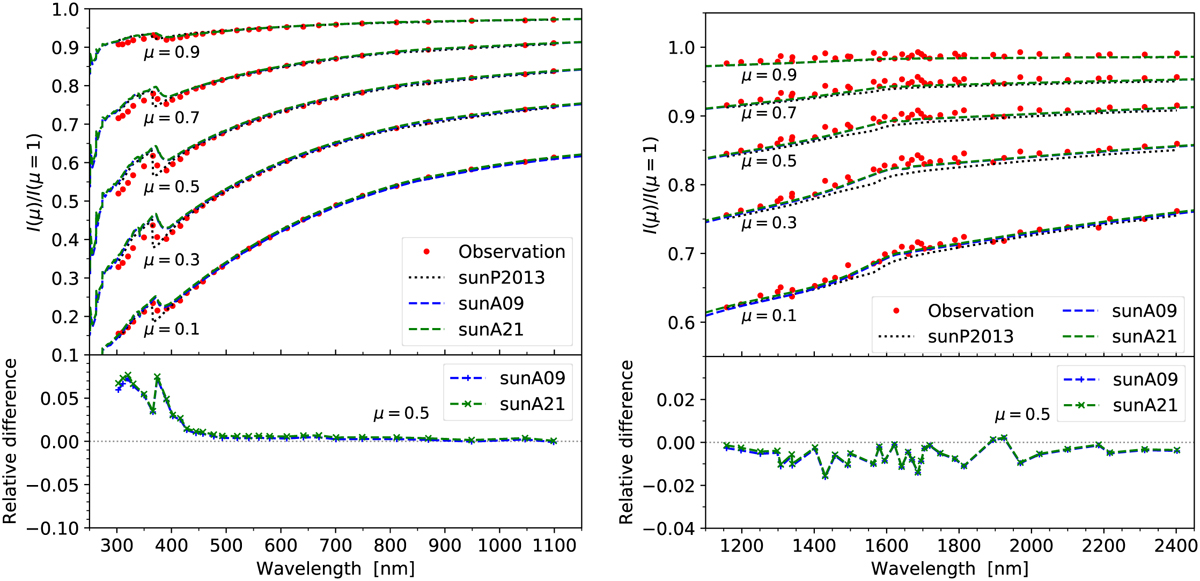
Continuum CLVs at different viewing angles in the optical and near-infrared wavelength range. Observational data (red dots) in the upper left and upper right panel are taken from Neckel & Labs (1994) and Pierce et al. (1977), respectively. Blue and green dashed lines are theoretical results of the sunA09 and sunA21 models computed using Balder. Continuum CLVs predicted by model sunP2013 are shown as black dotted lines (cf. Fig. 3 of P2013). Relative differences between the modelled and measured CLVs are demonstrated in the lower panels, computed via [I(µ)/I(µ = 1)]/[I(µ)/I(µ = 1)]obs − 1, where the subscript ‘obs’ stands for observational data. Only the difference at µ = 0.5 is shown for clarity.
Current usage metrics show cumulative count of Article Views (full-text article views including HTML views, PDF and ePub downloads, according to the available data) and Abstracts Views on Vision4Press platform.
Data correspond to usage on the plateform after 2015. The current usage metrics is available 48-96 hours after online publication and is updated daily on week days.
Initial download of the metrics may take a while.


