Fig. 9
Download original image
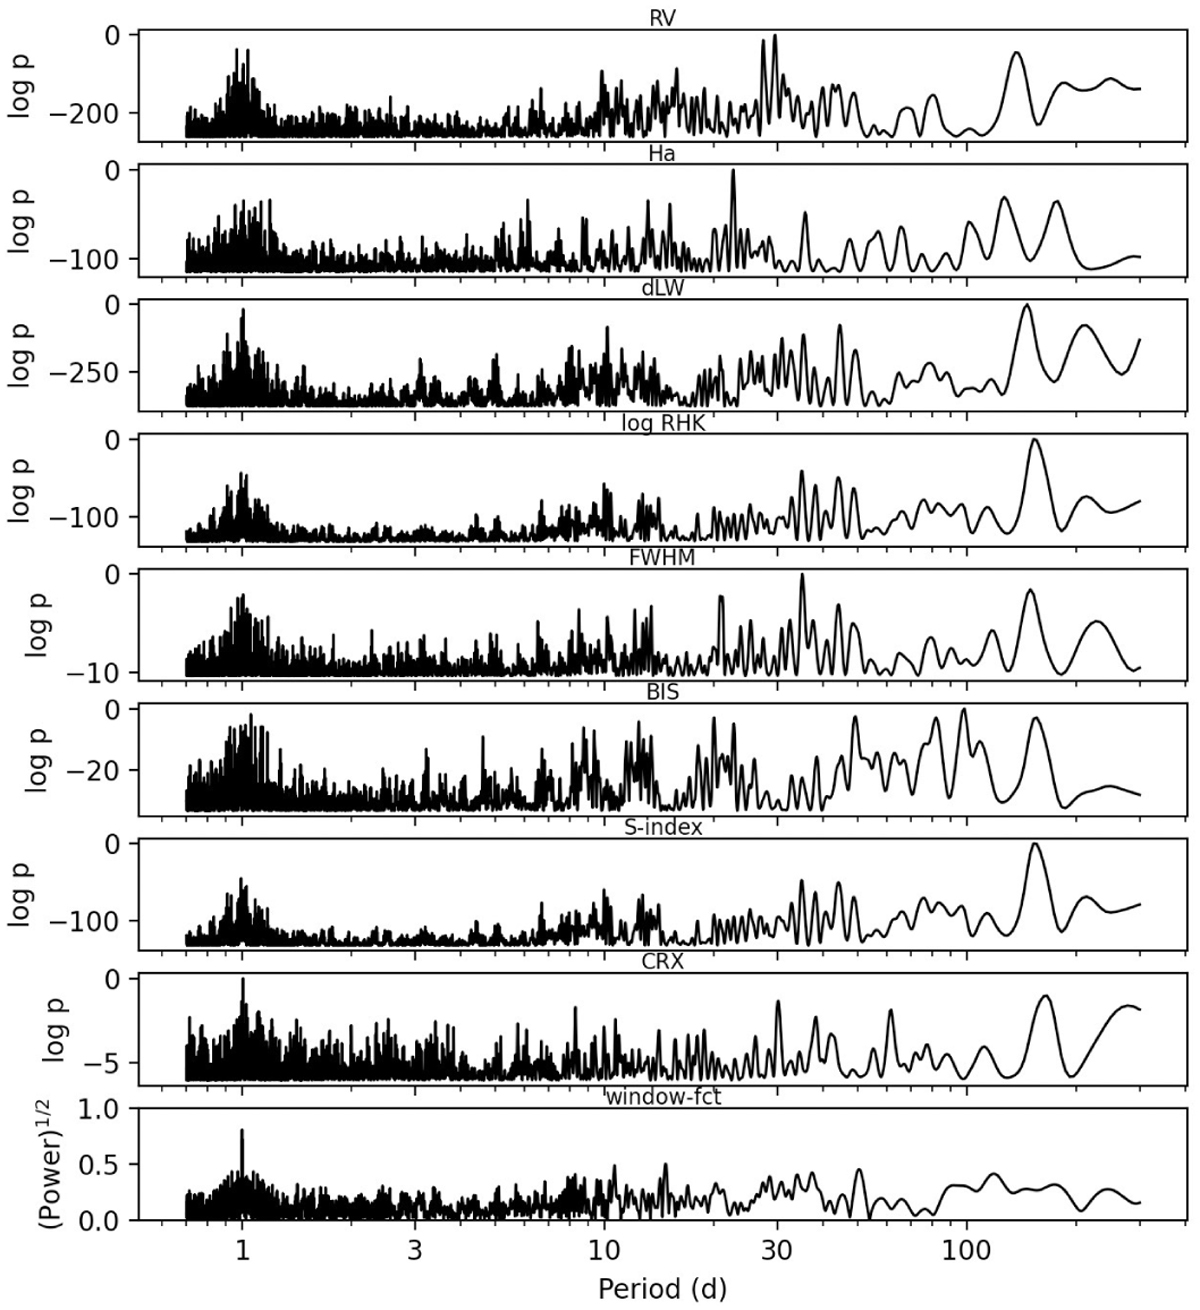
BGLS periodograms of the HARPS-N observations, for the measured RVs and for several activity indicators. The vertical scale is given in units of the logarithm of the Bayesian probability of a signal with a given period, where the highest peak is normalized to log p = 0. The lowest panel shows the spectral window function of the sampled data. See also Figs. 10 and B.1 for zoomed-in views around the 1.07 days and 29.5 days periods of planet b and the candidate c, respectively.
Current usage metrics show cumulative count of Article Views (full-text article views including HTML views, PDF and ePub downloads, according to the available data) and Abstracts Views on Vision4Press platform.
Data correspond to usage on the plateform after 2015. The current usage metrics is available 48-96 hours after online publication and is updated daily on week days.
Initial download of the metrics may take a while.