Fig. E.1
Download original image
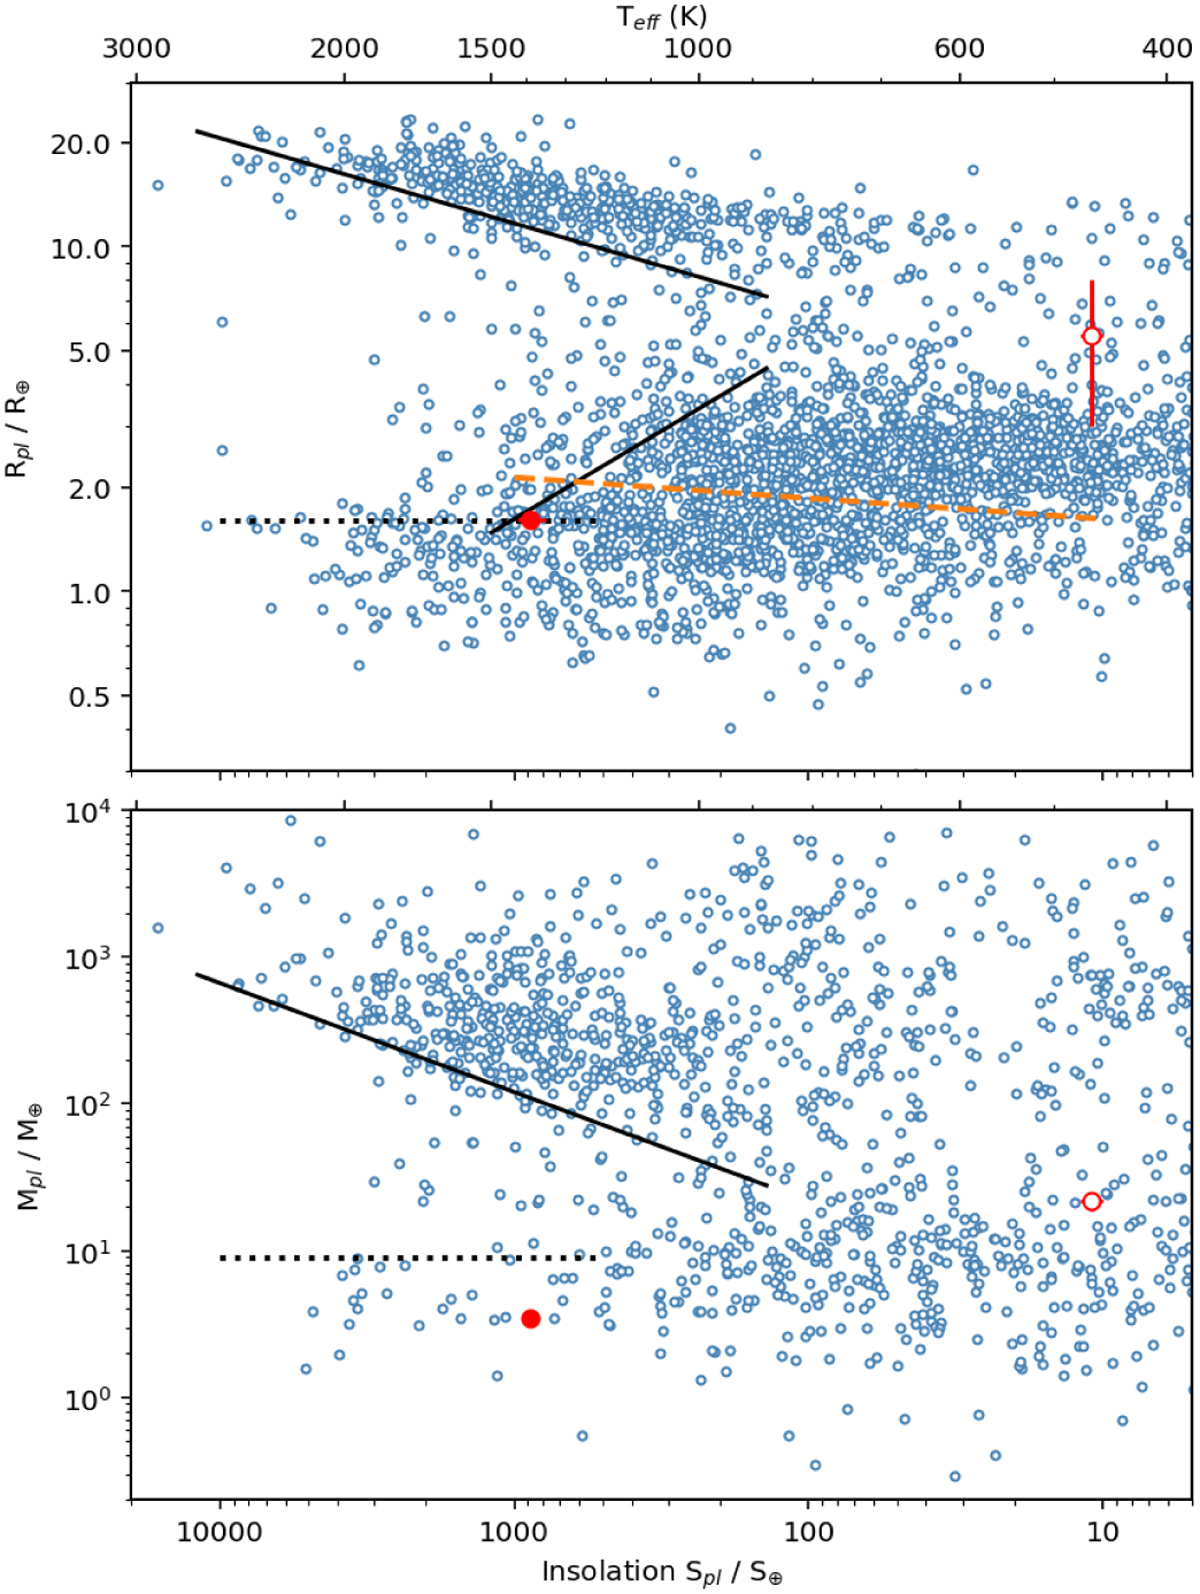
Similar to Fig. 16, but with planet radii (top panel) and masses (bottom panel) plotted against the planets’ insolation (lower X-axis) and their effective temperature (upper X-axis). The solid black lines show the delineation of the Neptune Desert against insolation and Teff, whereas the horizontal dotted black lines show the same lower limits to the Neptune Desert as those proposed for periods of P ≲ 2d. The dashed orange line in the upper panel indicates the radius valley against insolation from Petigura et al. (2022). TOI-1416 b is indicated by the filled red circle and c by the unfilled one.
Current usage metrics show cumulative count of Article Views (full-text article views including HTML views, PDF and ePub downloads, according to the available data) and Abstracts Views on Vision4Press platform.
Data correspond to usage on the plateform after 2015. The current usage metrics is available 48-96 hours after online publication and is updated daily on week days.
Initial download of the metrics may take a while.