Fig. D.2
Download original image
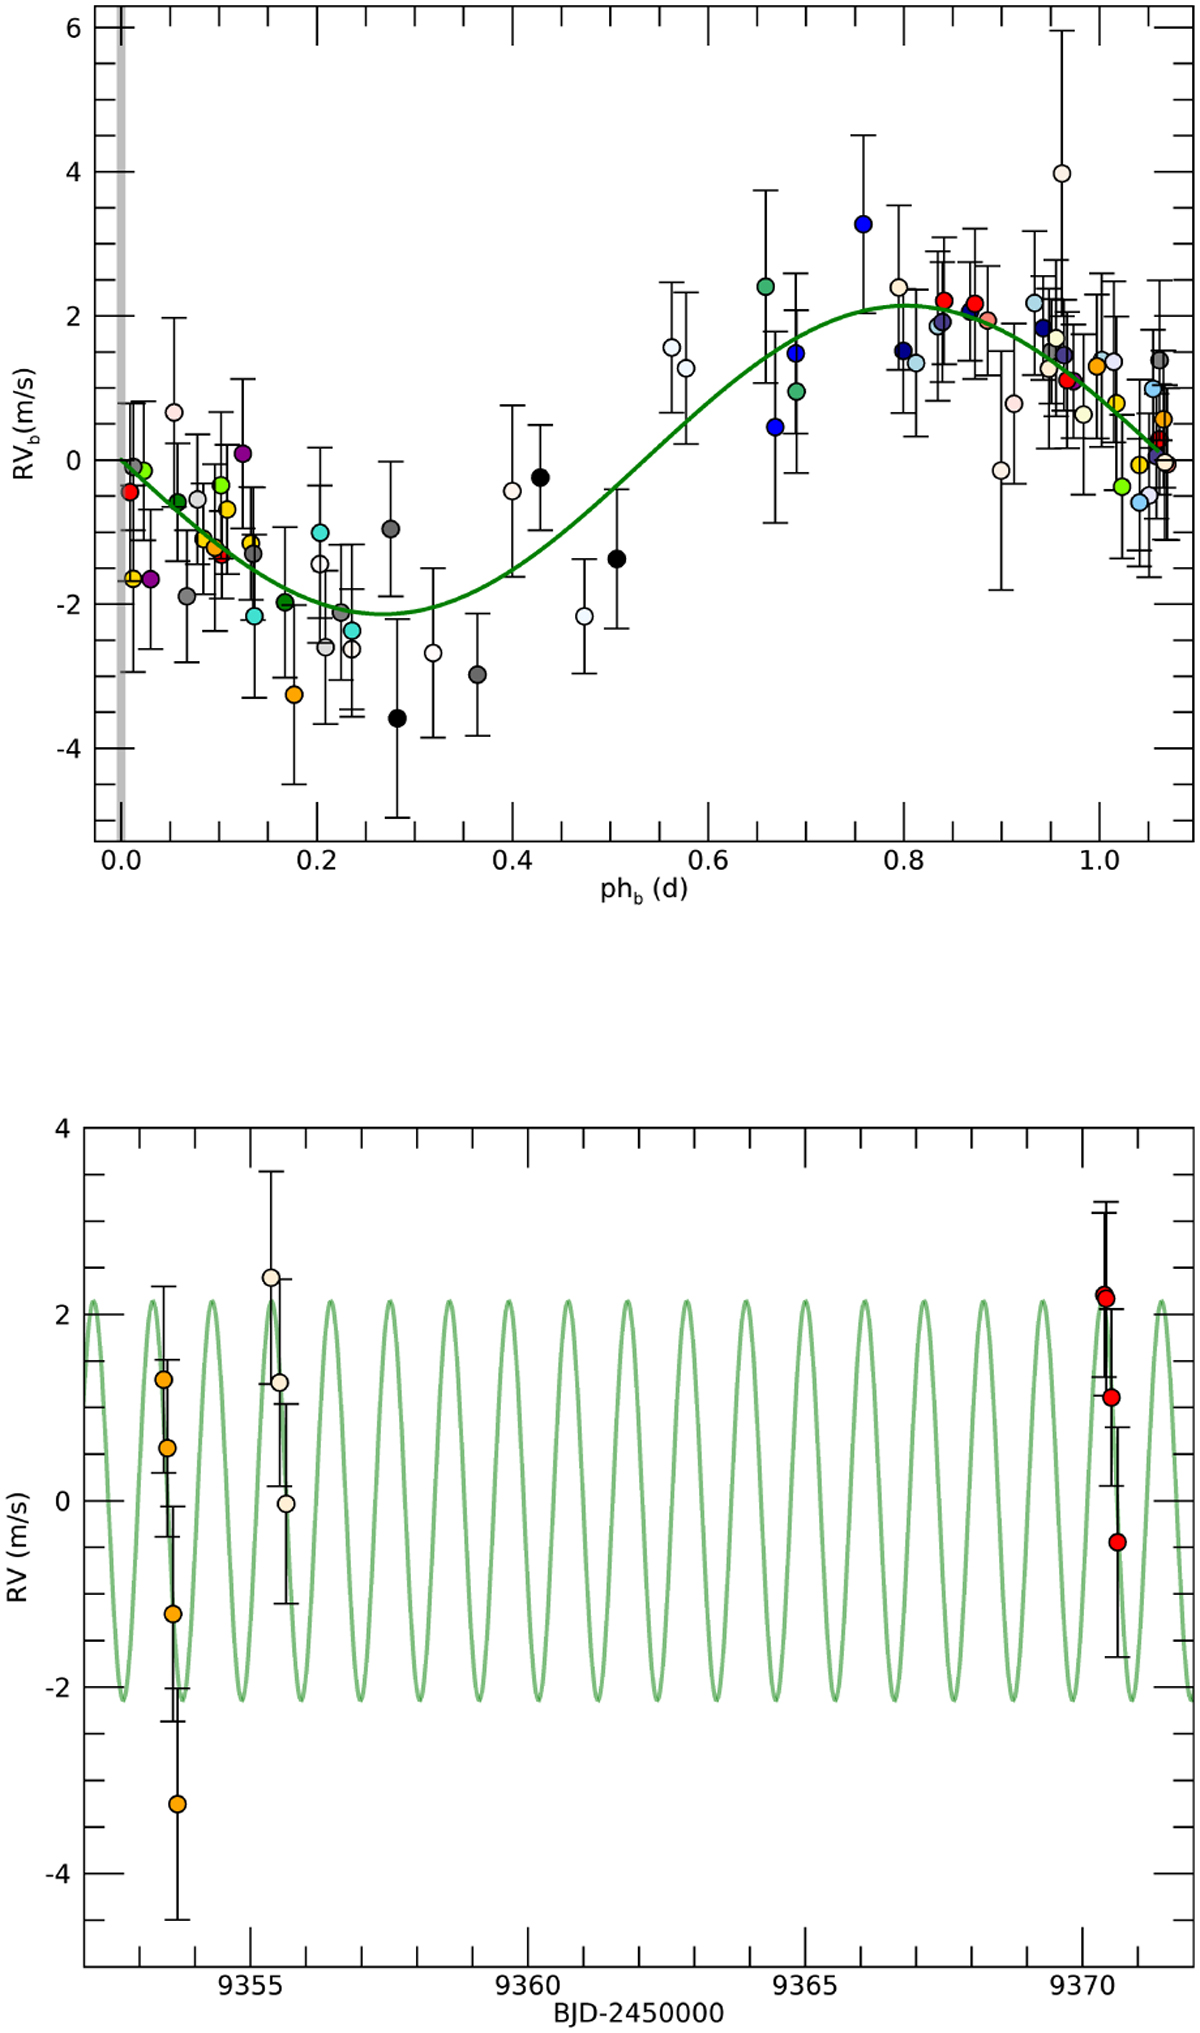
FCO fit to the HARPS-N RVs. Upper panel: Phase-folded RV model (green line) of TOI-1416 b, which corresponds to the best fit from the FCO method, obtained by vertically offsetting nightly chunks of RV data against the model. RV points from the same nights have identical colors. Lower panel: Small section of the RV model plotted against time, with RVs from three different nights.
Current usage metrics show cumulative count of Article Views (full-text article views including HTML views, PDF and ePub downloads, according to the available data) and Abstracts Views on Vision4Press platform.
Data correspond to usage on the plateform after 2015. The current usage metrics is available 48-96 hours after online publication and is updated daily on week days.
Initial download of the metrics may take a while.