Fig. B.7
Download original image
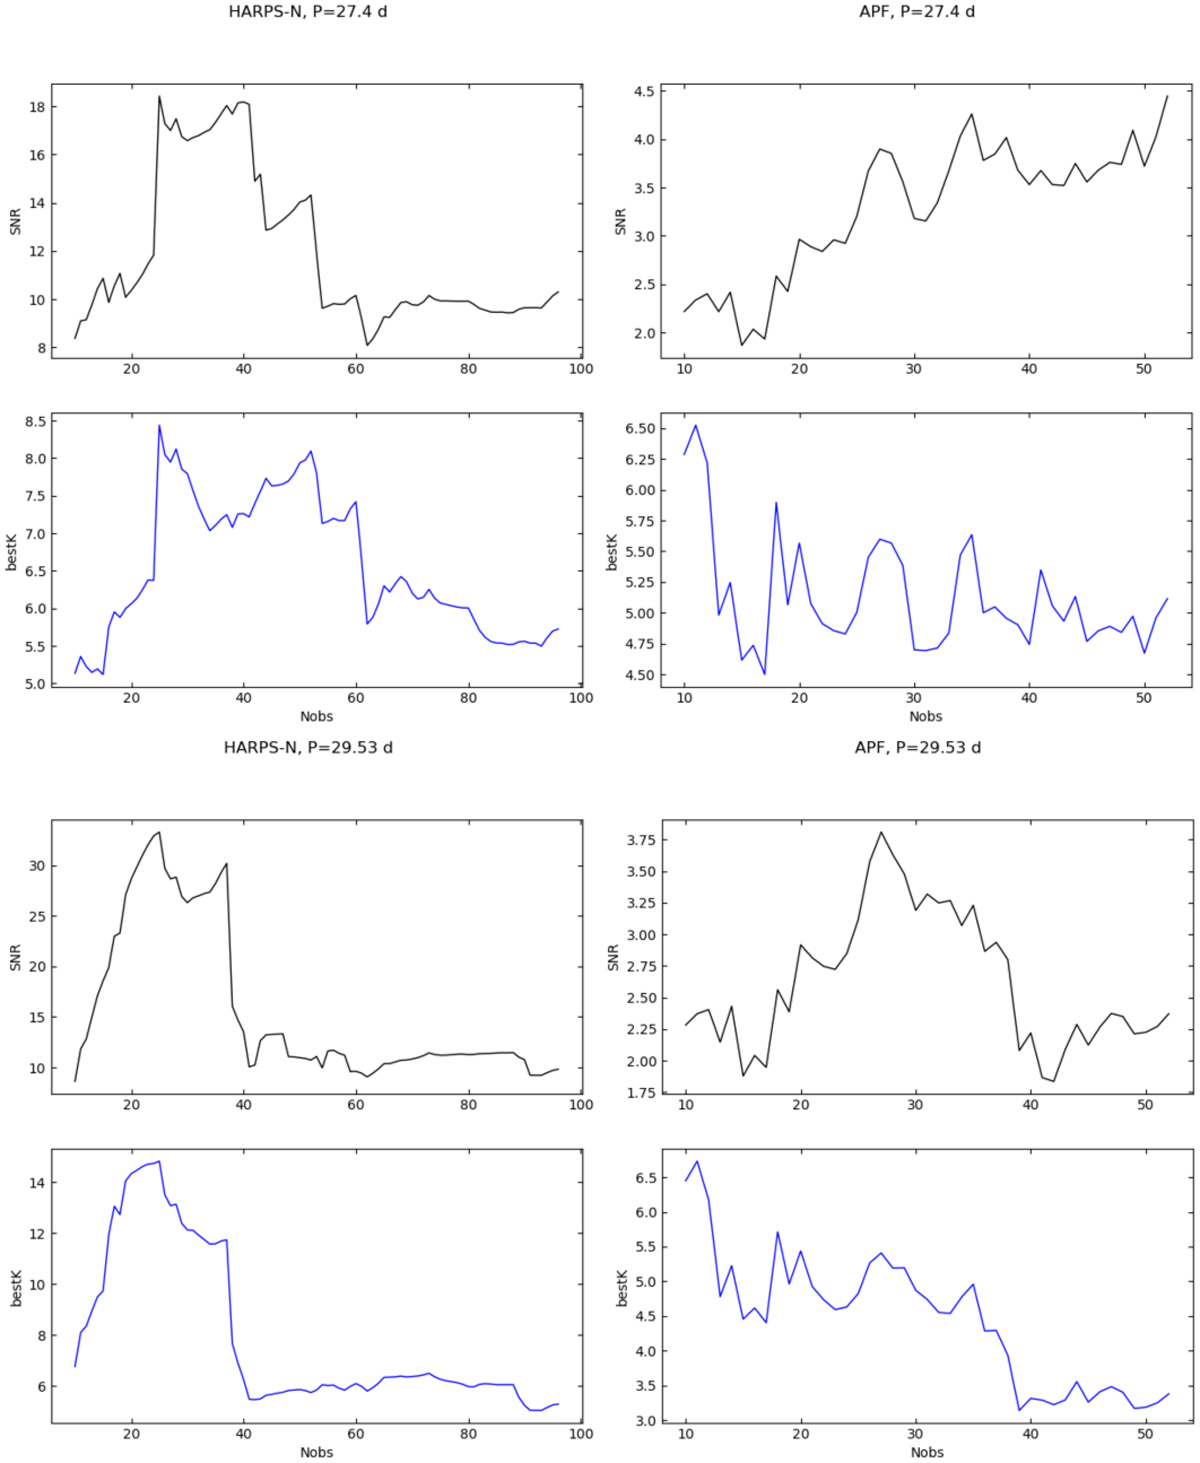
Development of the S/N (black curves) and the best-fitting amplitude “bestK” (blue curves, in m/s) of RV signals with periods of 27.40 d (top set of panels) and 29.53 d (bottom set), versus the number of RV points since the first measurement. The left panels are based on RVs from HARPS-N and the right ones on RVs from the APF.
Current usage metrics show cumulative count of Article Views (full-text article views including HTML views, PDF and ePub downloads, according to the available data) and Abstracts Views on Vision4Press platform.
Data correspond to usage on the plateform after 2015. The current usage metrics is available 48-96 hours after online publication and is updated daily on week days.
Initial download of the metrics may take a while.