Open Access
Fig. B.6
Download original image
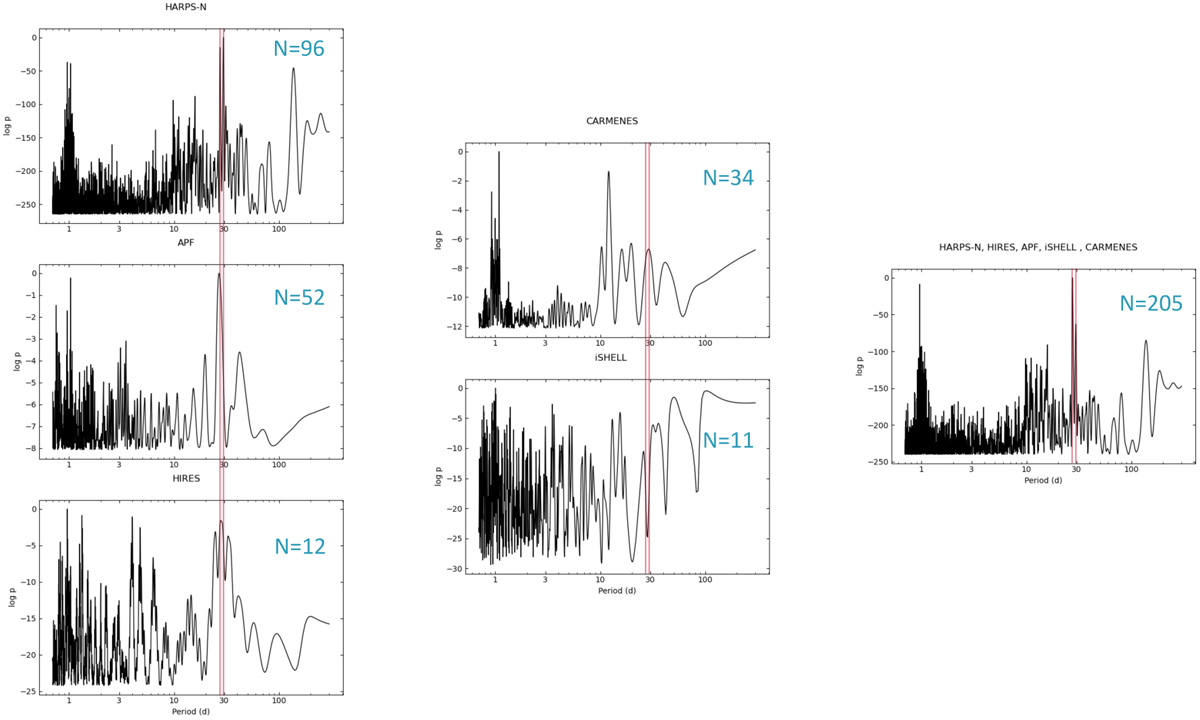
BGLS periodograms of the RVs of the contributing instruments. In the left column are those that show a peak near 27 or 29 days (vertical red lines); in the center are those that do not. The right panel shows a periodogram with the RVs from all instruments combined. The blue numbers indicate the number of RVs used.
Current usage metrics show cumulative count of Article Views (full-text article views including HTML views, PDF and ePub downloads, according to the available data) and Abstracts Views on Vision4Press platform.
Data correspond to usage on the plateform after 2015. The current usage metrics is available 48-96 hours after online publication and is updated daily on week days.
Initial download of the metrics may take a while.