Fig. 9
Download original image
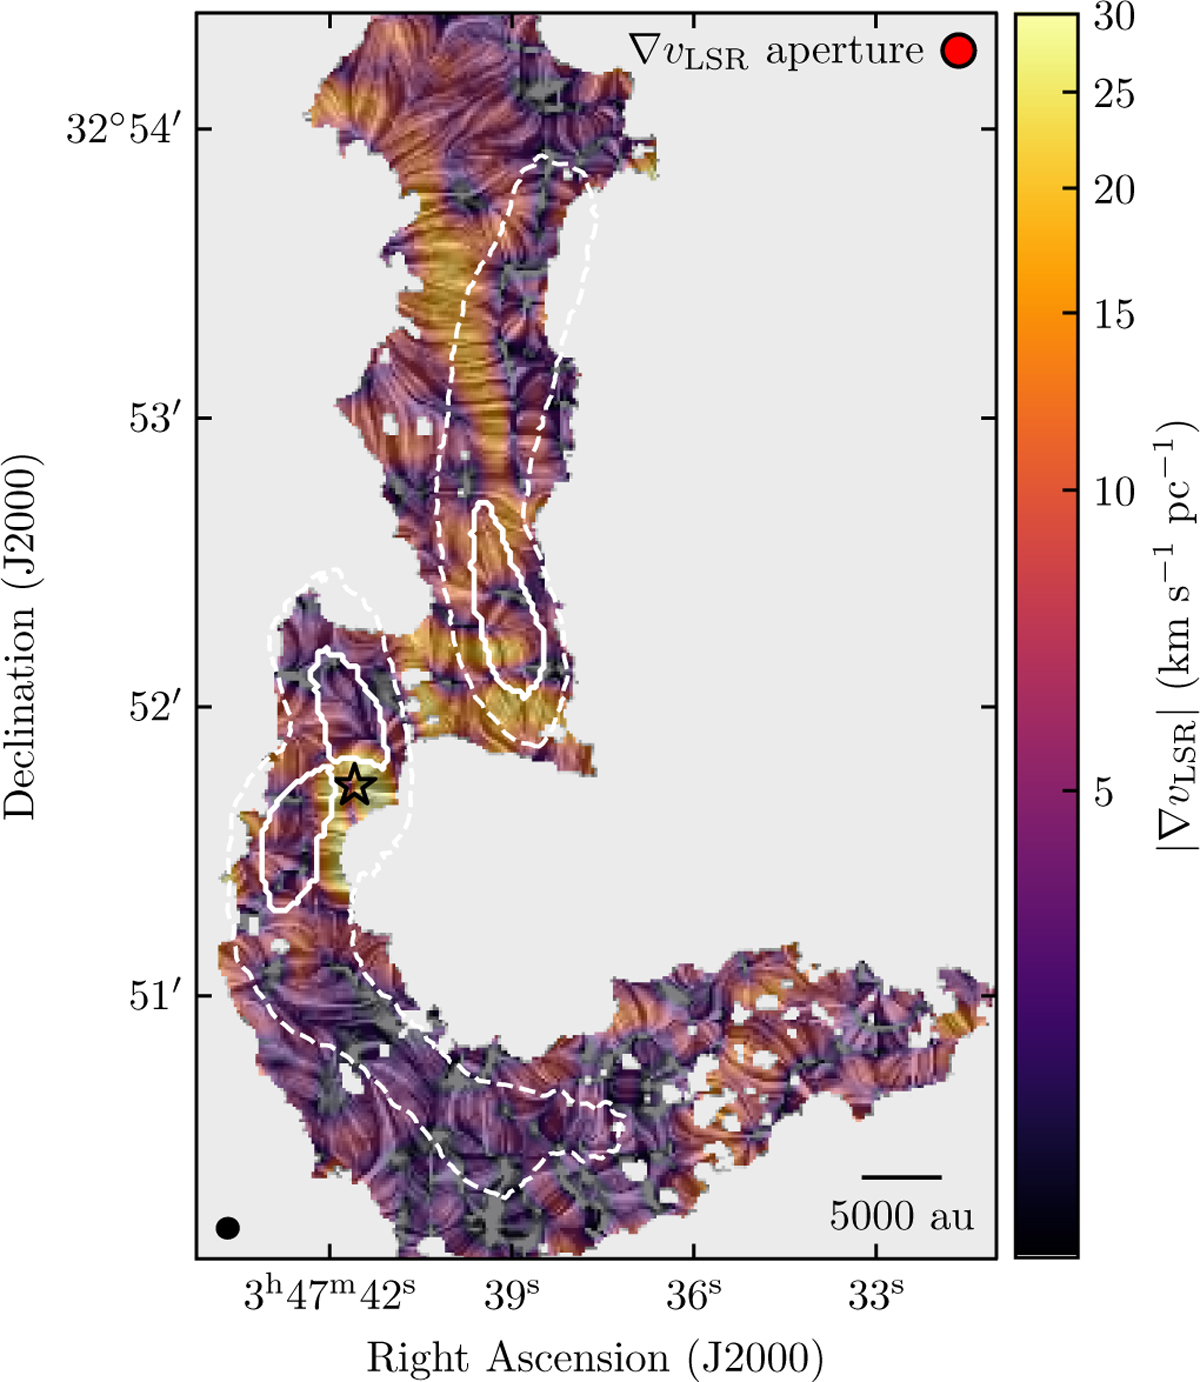
Velocity gradient intensities |∇vLSR| calculated from the Gaussian fit to HC3N (10 − 9) emission, with the gradient directions visualized as an overplotted texture using line integral convolution (LIC. Cabral & Leedom 1993). The black star indicates the position of B5-IRS1. The black ellipse in the bottom left corner represents the beam size. The red circle at the top right corner represents the area used to calculate the gradients. White dashed contours outline the NH3 filaments (P15; S21). White solid contours outline the edges of the condensations (P15). The scalebar at the bottom right corner represents a physical distance of 5000 au.
Current usage metrics show cumulative count of Article Views (full-text article views including HTML views, PDF and ePub downloads, according to the available data) and Abstracts Views on Vision4Press platform.
Data correspond to usage on the plateform after 2015. The current usage metrics is available 48-96 hours after online publication and is updated daily on week days.
Initial download of the metrics may take a while.