Fig. 8
Download original image
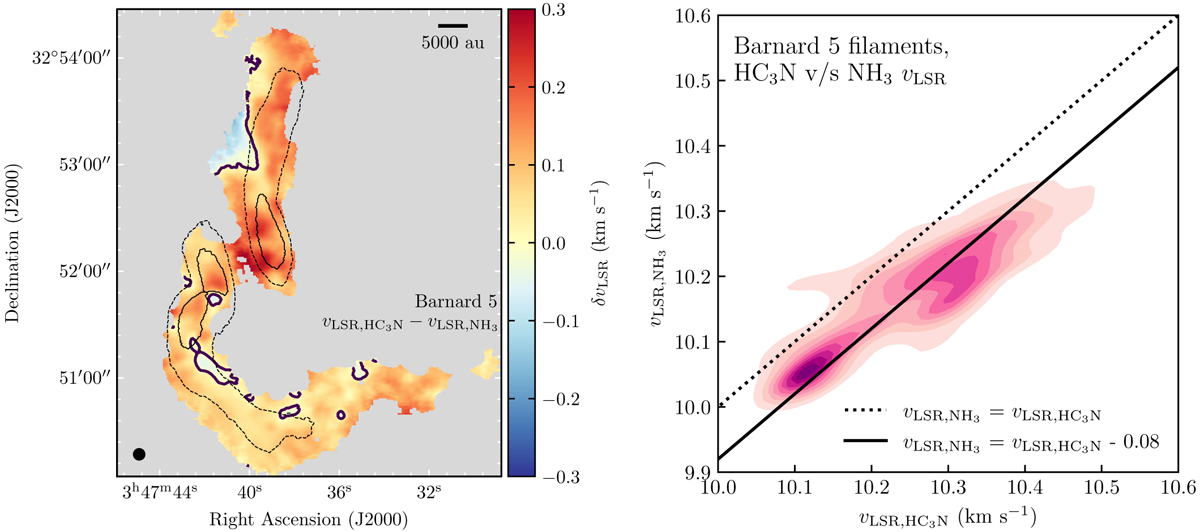
Difference between HC3N (10−9) line emission and NH3 (1,1) line emission central velocities in both filaments of Barnard 5. Left: spatial map showing the difference of HC3N(10 − 9) central velocities with respect to NH3 (1,1) velocities. Black thick contours mark the positions where the difference is 0. The resolution of the HC3N (10−9) data is on the lower left corner. The dotted contours show the filaments and the black solid contours outline the condensations as defined in P15 and S21. Right: ![]() versus
versus ![]() Distribution of the velocity difference shown using its KDE. The dashed vertical line represents the 1:1 line, and the solid line is shifted by −0.08, which is the median value of the difference between both velocities.
Distribution of the velocity difference shown using its KDE. The dashed vertical line represents the 1:1 line, and the solid line is shifted by −0.08, which is the median value of the difference between both velocities.
Current usage metrics show cumulative count of Article Views (full-text article views including HTML views, PDF and ePub downloads, according to the available data) and Abstracts Views on Vision4Press platform.
Data correspond to usage on the plateform after 2015. The current usage metrics is available 48-96 hours after online publication and is updated daily on week days.
Initial download of the metrics may take a while.