Fig. 7
Download original image
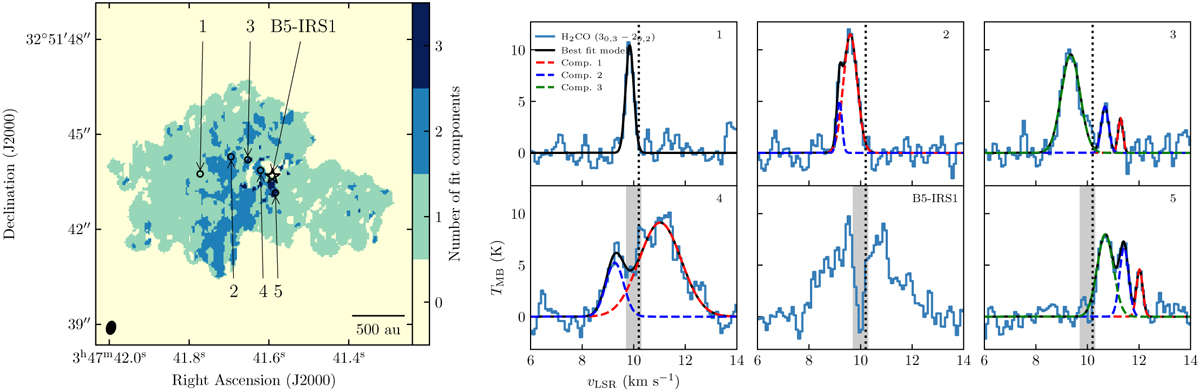
Results of the Gaussian fit to the ALMA H2CO spectra. Left: number of components that best fit each H2CO spectrum according to the criteria described in Appendix D. The black ellipse in the bottom left corner represents the beam size. The black star marks the position of the protostar. Locations of sampled spectra are marked with empty black circles and labeled. Right: selected H2CO spectra with the best fit Gaussian components. The spectra are taken from one single pixel. The data are plotted with a solid blue line. The dashed lines represent the best fit Gaussians, with red for the first component, blue for the second and green for the third. The black solid line represents the sum of all components. The gray vertical area marks the channels that were masked for the fit for spectra located within 0″.8 from the protostar. The dotted black vertical line marks the protostar’s vLSR.
Current usage metrics show cumulative count of Article Views (full-text article views including HTML views, PDF and ePub downloads, according to the available data) and Abstracts Views on Vision4Press platform.
Data correspond to usage on the plateform after 2015. The current usage metrics is available 48-96 hours after online publication and is updated daily on week days.
Initial download of the metrics may take a while.