Fig. H.1
Download original image
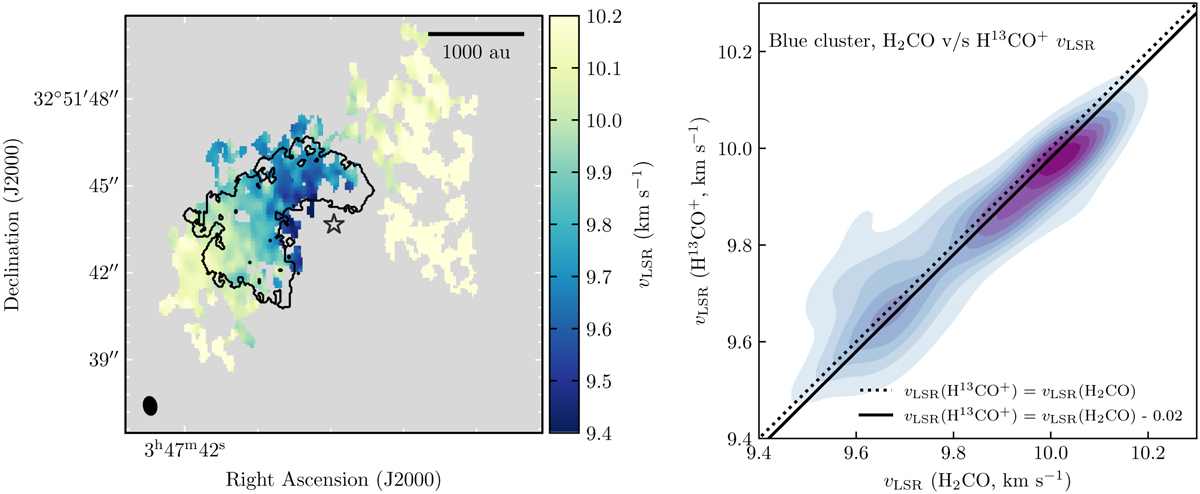
Comparison between the vLSR found for H13CO+ observations from van’t Hoff et al. (2022) and our H2CO vLSR results. Left: Central velocities obtained through the Gaussian fit to H13CO+ observations from van’t Hoff et al. (2022). The black ellipse represents the beam size. The black contour indicates the area covered by the H2CO blueshifted cluster found using DBSCAN. The black star represents the position of B5-IRS1. Right: KDE of the difference between the central velocities of H2CO and H13CO+ emission. The dotted line shows the one-to-one relation, and the solid line shows the same relation but displaced by 0.02 km s−1
Current usage metrics show cumulative count of Article Views (full-text article views including HTML views, PDF and ePub downloads, according to the available data) and Abstracts Views on Vision4Press platform.
Data correspond to usage on the plateform after 2015. The current usage metrics is available 48-96 hours after online publication and is updated daily on week days.
Initial download of the metrics may take a while.