Fig. G.2
Download original image
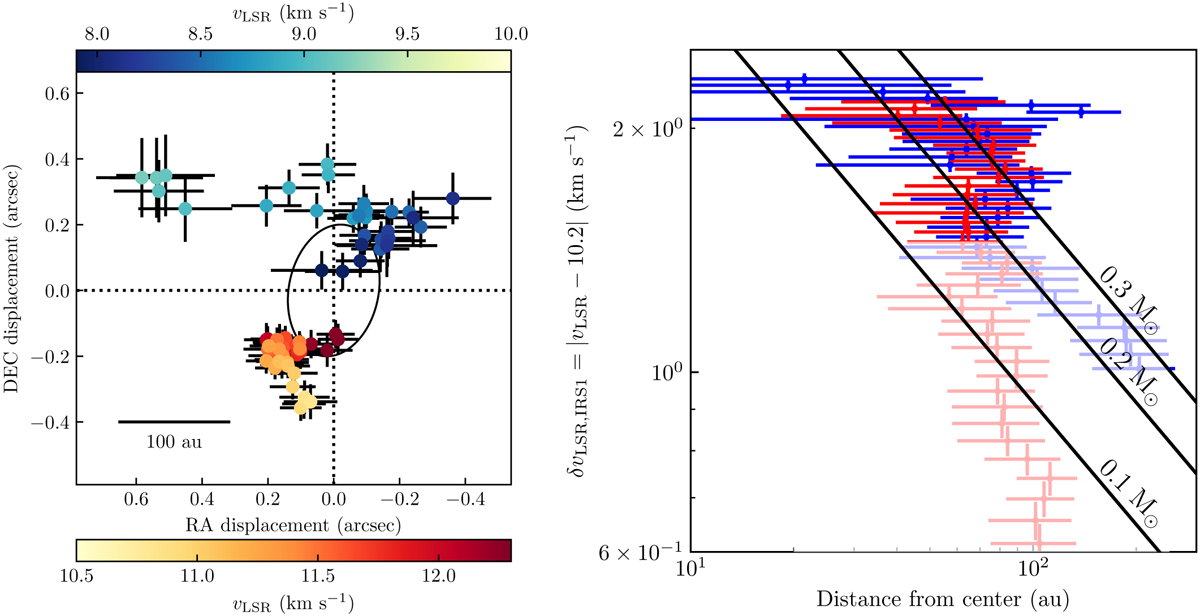
Results from the two-dimensional Gaussian fit to the C18O channel maps. Left: Best fit central positions with respect to the image plane, where their colors represent the velocity of the channel vLSR. The dashed lines represent the position of the barycenter. The ellipse centered at the barycenter represents the beam size (FWHM). Right: C18O emission velocity with respect to the protostar’s vLSR versus distance from the protostar. Blue dots are obtained from the C18O emission blueshifted with respect to the protostar and red dots from the redshifted emission. Faded dots come from velocity channels with considerable extended emission, and therefore their properties are affected by motions other than Keplerian. The solid black lines are the Keplerian rotation profiles for 0.1, 0.2 and 0.3 M⊙.
Current usage metrics show cumulative count of Article Views (full-text article views including HTML views, PDF and ePub downloads, according to the available data) and Abstracts Views on Vision4Press platform.
Data correspond to usage on the plateform after 2015. The current usage metrics is available 48-96 hours after online publication and is updated daily on week days.
Initial download of the metrics may take a while.