Fig. F.1
Download original image
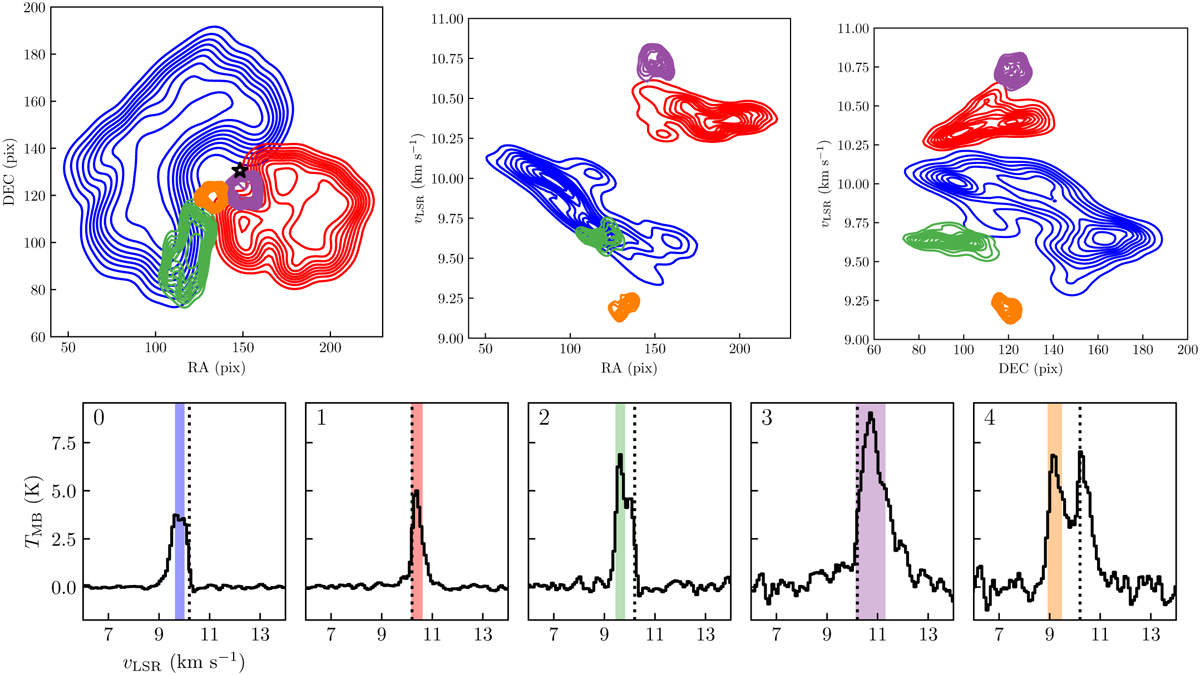
Results from the clustering of the Gaussian components in the ALMA H2CO spectra. Each cluster is labeled with a number from 0 to 4, in order of descending number of points. Blue and red points (labeled 0 and 1) represent the clusters named blueshifted and redshifted component, respectively. Orange, purple and green points represent the other three found clusters. Top: Density plots of the clustered groups using Gaussian KDEs, seen in the image plane (RA and DEC in pixels, left), in RA versus vLSR (middle) and in DEC versus vLSR (right). The black star marks the position of the protostar. Bottom: average spectra taken from the area covered by each group, labeled with the numbers from the Top Left panel. The ALMA H2CO spectra are drawn with black solid lines. The colored vertical areas represent the location of average vLSR and FWHM of each cluster. The vertical dotted line marks the protostar’s vLSR.
Current usage metrics show cumulative count of Article Views (full-text article views including HTML views, PDF and ePub downloads, according to the available data) and Abstracts Views on Vision4Press platform.
Data correspond to usage on the plateform after 2015. The current usage metrics is available 48-96 hours after online publication and is updated daily on week days.
Initial download of the metrics may take a while.