Fig. E.2
Download original image
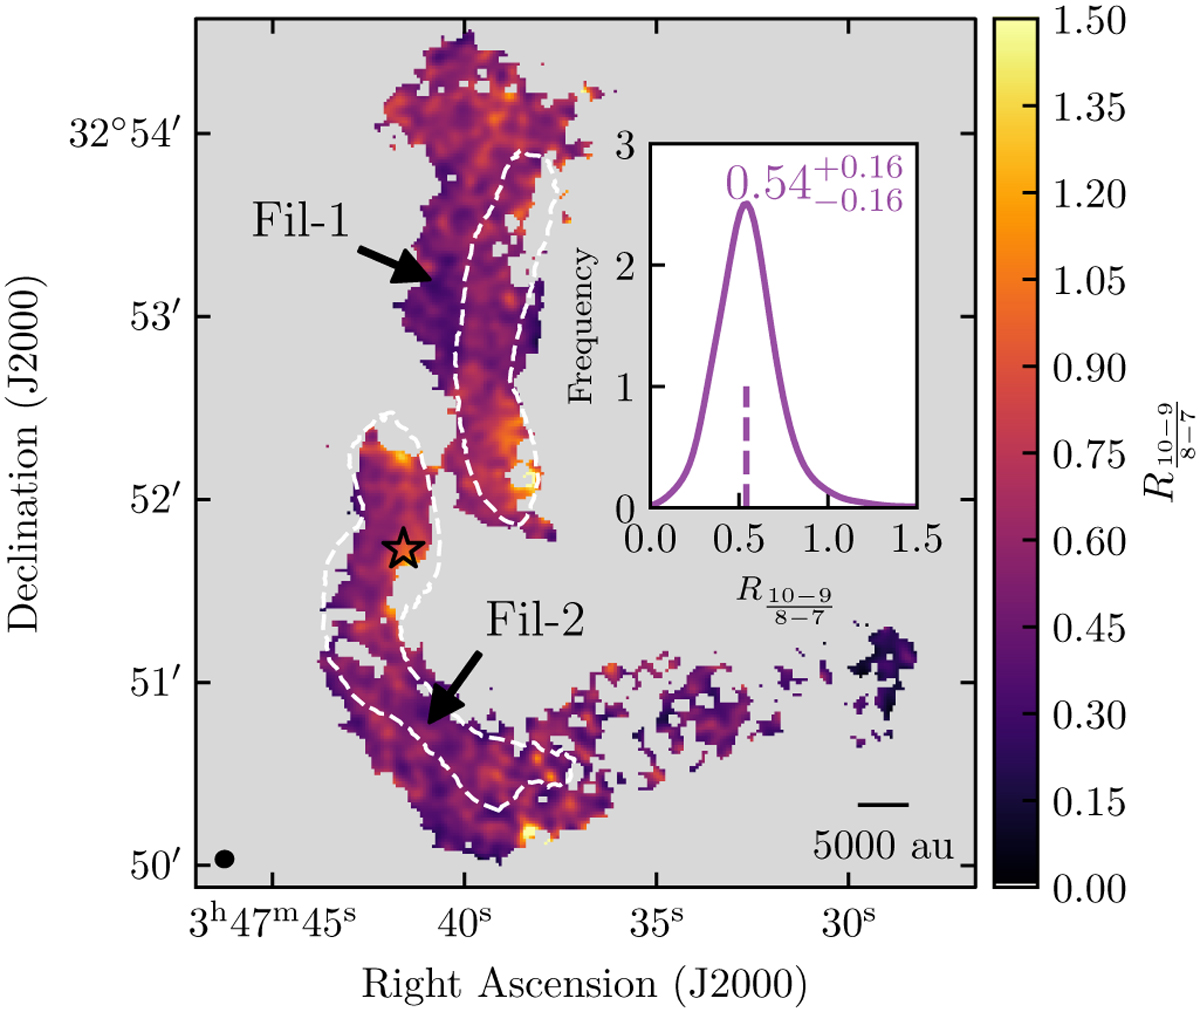
Map of the line ratio between the HC3N (10 − 9) and (8 − 7) transitions. White dashed contours correspond to the filaments identified in NH3 emission by P15 and S21. The black star marks the position of the protostar B5-IRS1. Inset: KDE of the line ratios obtained. The dashed vertical line shows the median value of the distribution, and the uncertainties correspond to the distance to the 1st and 3rd quartiles.
Current usage metrics show cumulative count of Article Views (full-text article views including HTML views, PDF and ePub downloads, according to the available data) and Abstracts Views on Vision4Press platform.
Data correspond to usage on the plateform after 2015. The current usage metrics is available 48-96 hours after online publication and is updated daily on week days.
Initial download of the metrics may take a while.