Fig. 13
Download original image
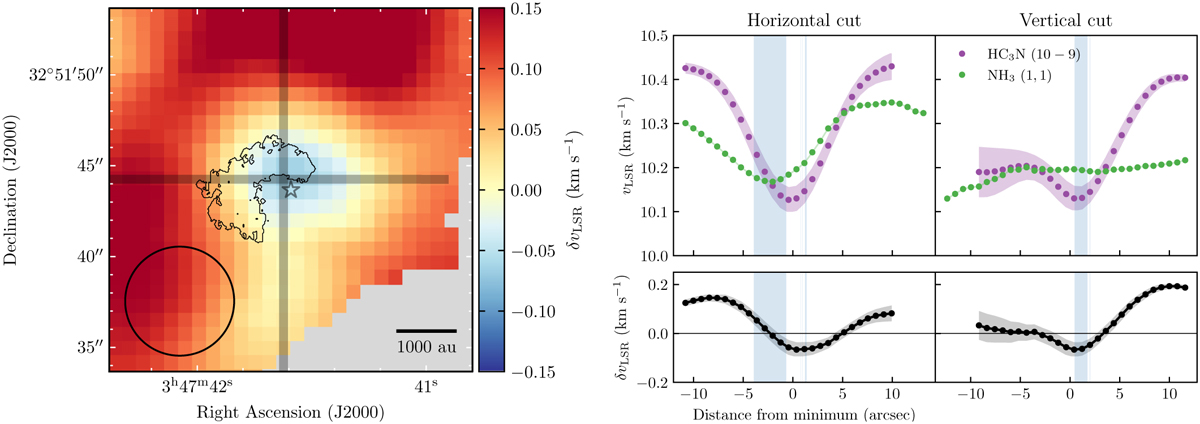
Left: zoom into δvLSR from Fig. 8 toward the position of the protostar. The black contours mark the region of the blue streamer found in Sect. 4.2.1. The horizontal and vertical black lines show the positions of the horizontal and vertical cuts for the plots on the right. The black circle at the lower left corner represents the beam size of the NH3 (1,1) observations. Right: horizontal and vertical cuts of HC3N vLSR and NH3 vLSR. The purple points with the purple area represent the HC3N (10 − 9) vLSR and its associated uncertainty after smoothing to reach the same resolution as the NH3 (1,1) vLSR. The green points represent the NH3 (1,1) vLSR (the uncertainties are roughly the size of the points). The black curves and black areas represent the difference between HC3N (10 − 9) NH3 (1,1) vLSR. The blue areas represent the location covered by the blue streamer.
Current usage metrics show cumulative count of Article Views (full-text article views including HTML views, PDF and ePub downloads, according to the available data) and Abstracts Views on Vision4Press platform.
Data correspond to usage on the plateform after 2015. The current usage metrics is available 48-96 hours after online publication and is updated daily on week days.
Initial download of the metrics may take a while.