Fig. 4.
Download original image
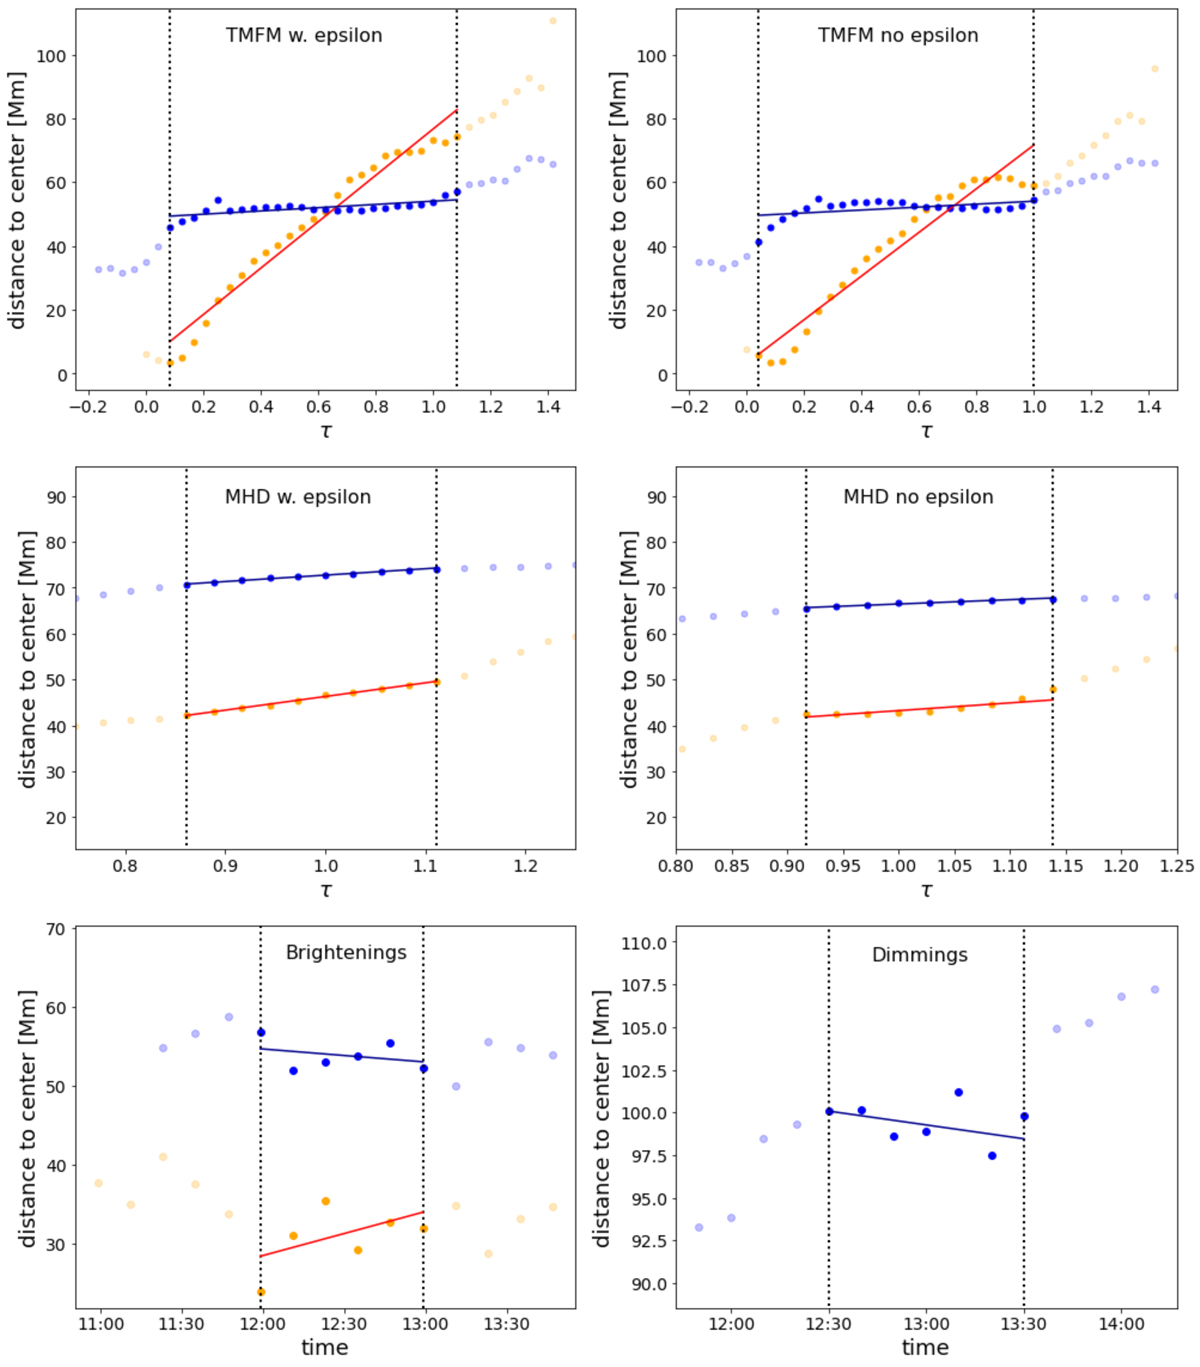
Distance of the footpoint or feature location from its respective centroid for footpoints from TMFM and MHD, as well as brightenings and dimmings. The x-axis depicts the normalised time τ (see Sect. 3.4). Orange: western footpoint (positive polarity) region. Blue: eastern footpoint (negative polarity) region. In the top two panels, the pair of vertical lines shows the frames when the apex of the FR was between 10% and 100% of the simulation box. For the MHD results in the middle panel, we used a velocity threshold to identify relevant frames (cf. Fig. 3). For the brightening and dimming time window, we followed the steps presented in Sect. 3.3.
Current usage metrics show cumulative count of Article Views (full-text article views including HTML views, PDF and ePub downloads, according to the available data) and Abstracts Views on Vision4Press platform.
Data correspond to usage on the plateform after 2015. The current usage metrics is available 48-96 hours after online publication and is updated daily on week days.
Initial download of the metrics may take a while.