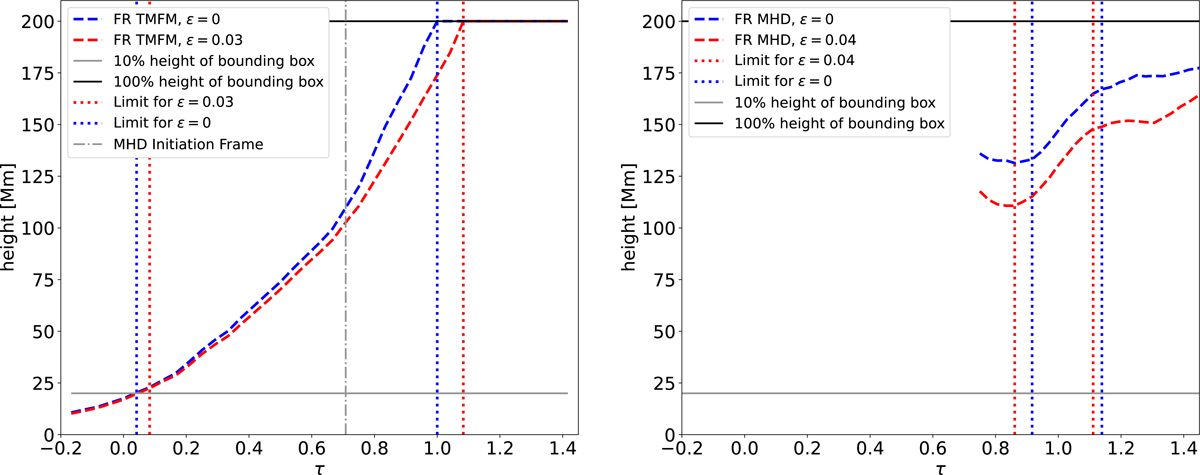
Fig. 3.
Download original image
Evolution of the height of the apex of the FR as extracted from the TMFM simulation (left panel) and from the zero-beta MHD relaxation (right panels). The blue dashed curve shows the results when applying the extraction scheme without ϵ prescription, while the red dashed curve depicts the FR height evolution with ϵ = 0.03 for the TMFM runs and ϵ = 0.04 for the MHD runs (see Sect. 3.1). The x-axis depicts the time normalised to the TMFM flux evolution (Sect. 3.4). The horizontal lines show 10% (grey) and 100% (black) of the domain height. The dotted vertical lines indicate the start- and endpoints of our analysis with (red) and without ϵ-prescription (blue), as described in Sect. 4.1.
Current usage metrics show cumulative count of Article Views (full-text article views including HTML views, PDF and ePub downloads, according to the available data) and Abstracts Views on Vision4Press platform.
Data correspond to usage on the plateform after 2015. The current usage metrics is available 48-96 hours after online publication and is updated daily on week days.
Initial download of the metrics may take a while.