Fig. 1.
Download original image
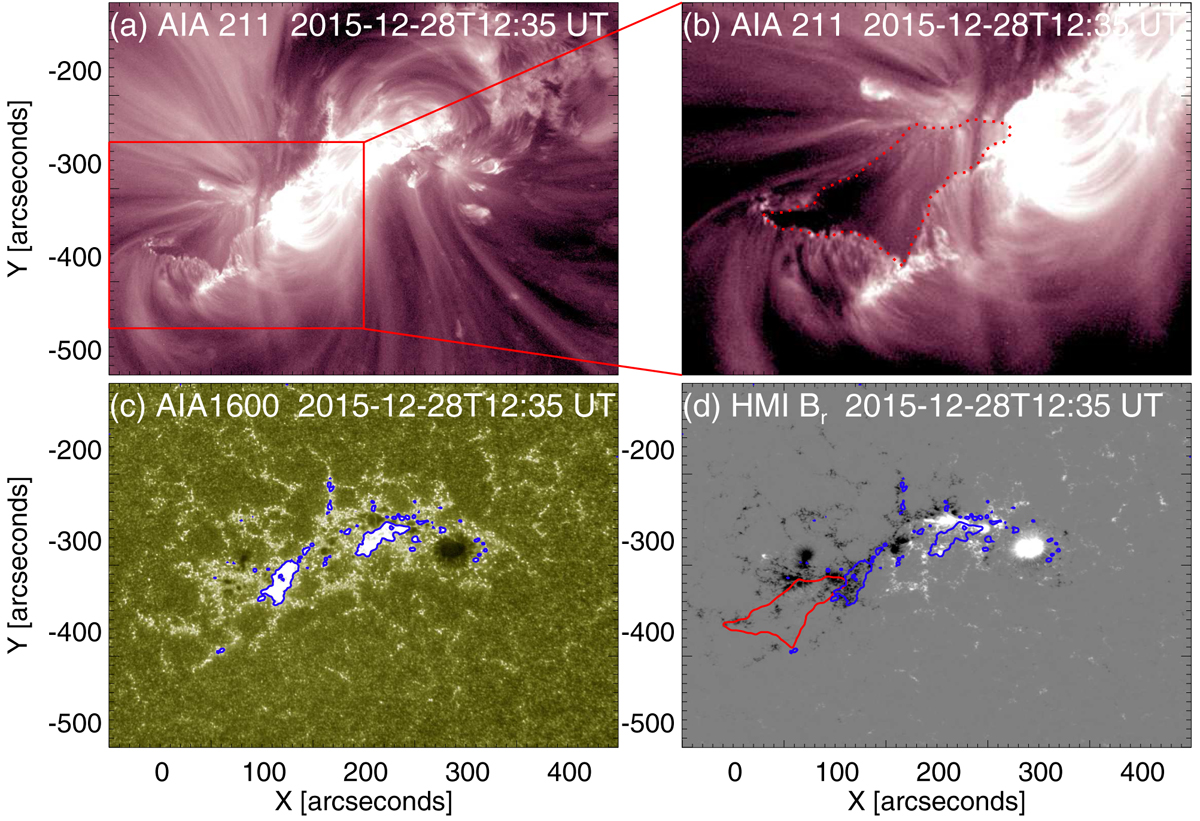
Core dimming and brightenings. The core dimming in the southeast part of the erupting region as observed in the AIA 211 Å passband is depicted in panel a. The region bounded by the red rectangle in panel a is shown in panel b. The core dimming area is marked by the red dotted contour in panel b. An observation of the active region in the AIA 1600 Å passband is shown in panel c. Brightenings associated with the flare ribbons are marked by the blue contours. The radial component of the HMI vector magnetic field is plotted in grey scale with saturation values ±1000 G in panel d. The blue contours in panel d are the same as those plotted in panel c. The red contour in panel d denotes the boundary of the core dimming as marked in panel b.
Current usage metrics show cumulative count of Article Views (full-text article views including HTML views, PDF and ePub downloads, according to the available data) and Abstracts Views on Vision4Press platform.
Data correspond to usage on the plateform after 2015. The current usage metrics is available 48-96 hours after online publication and is updated daily on week days.
Initial download of the metrics may take a while.