Fig. 6.

Download original image
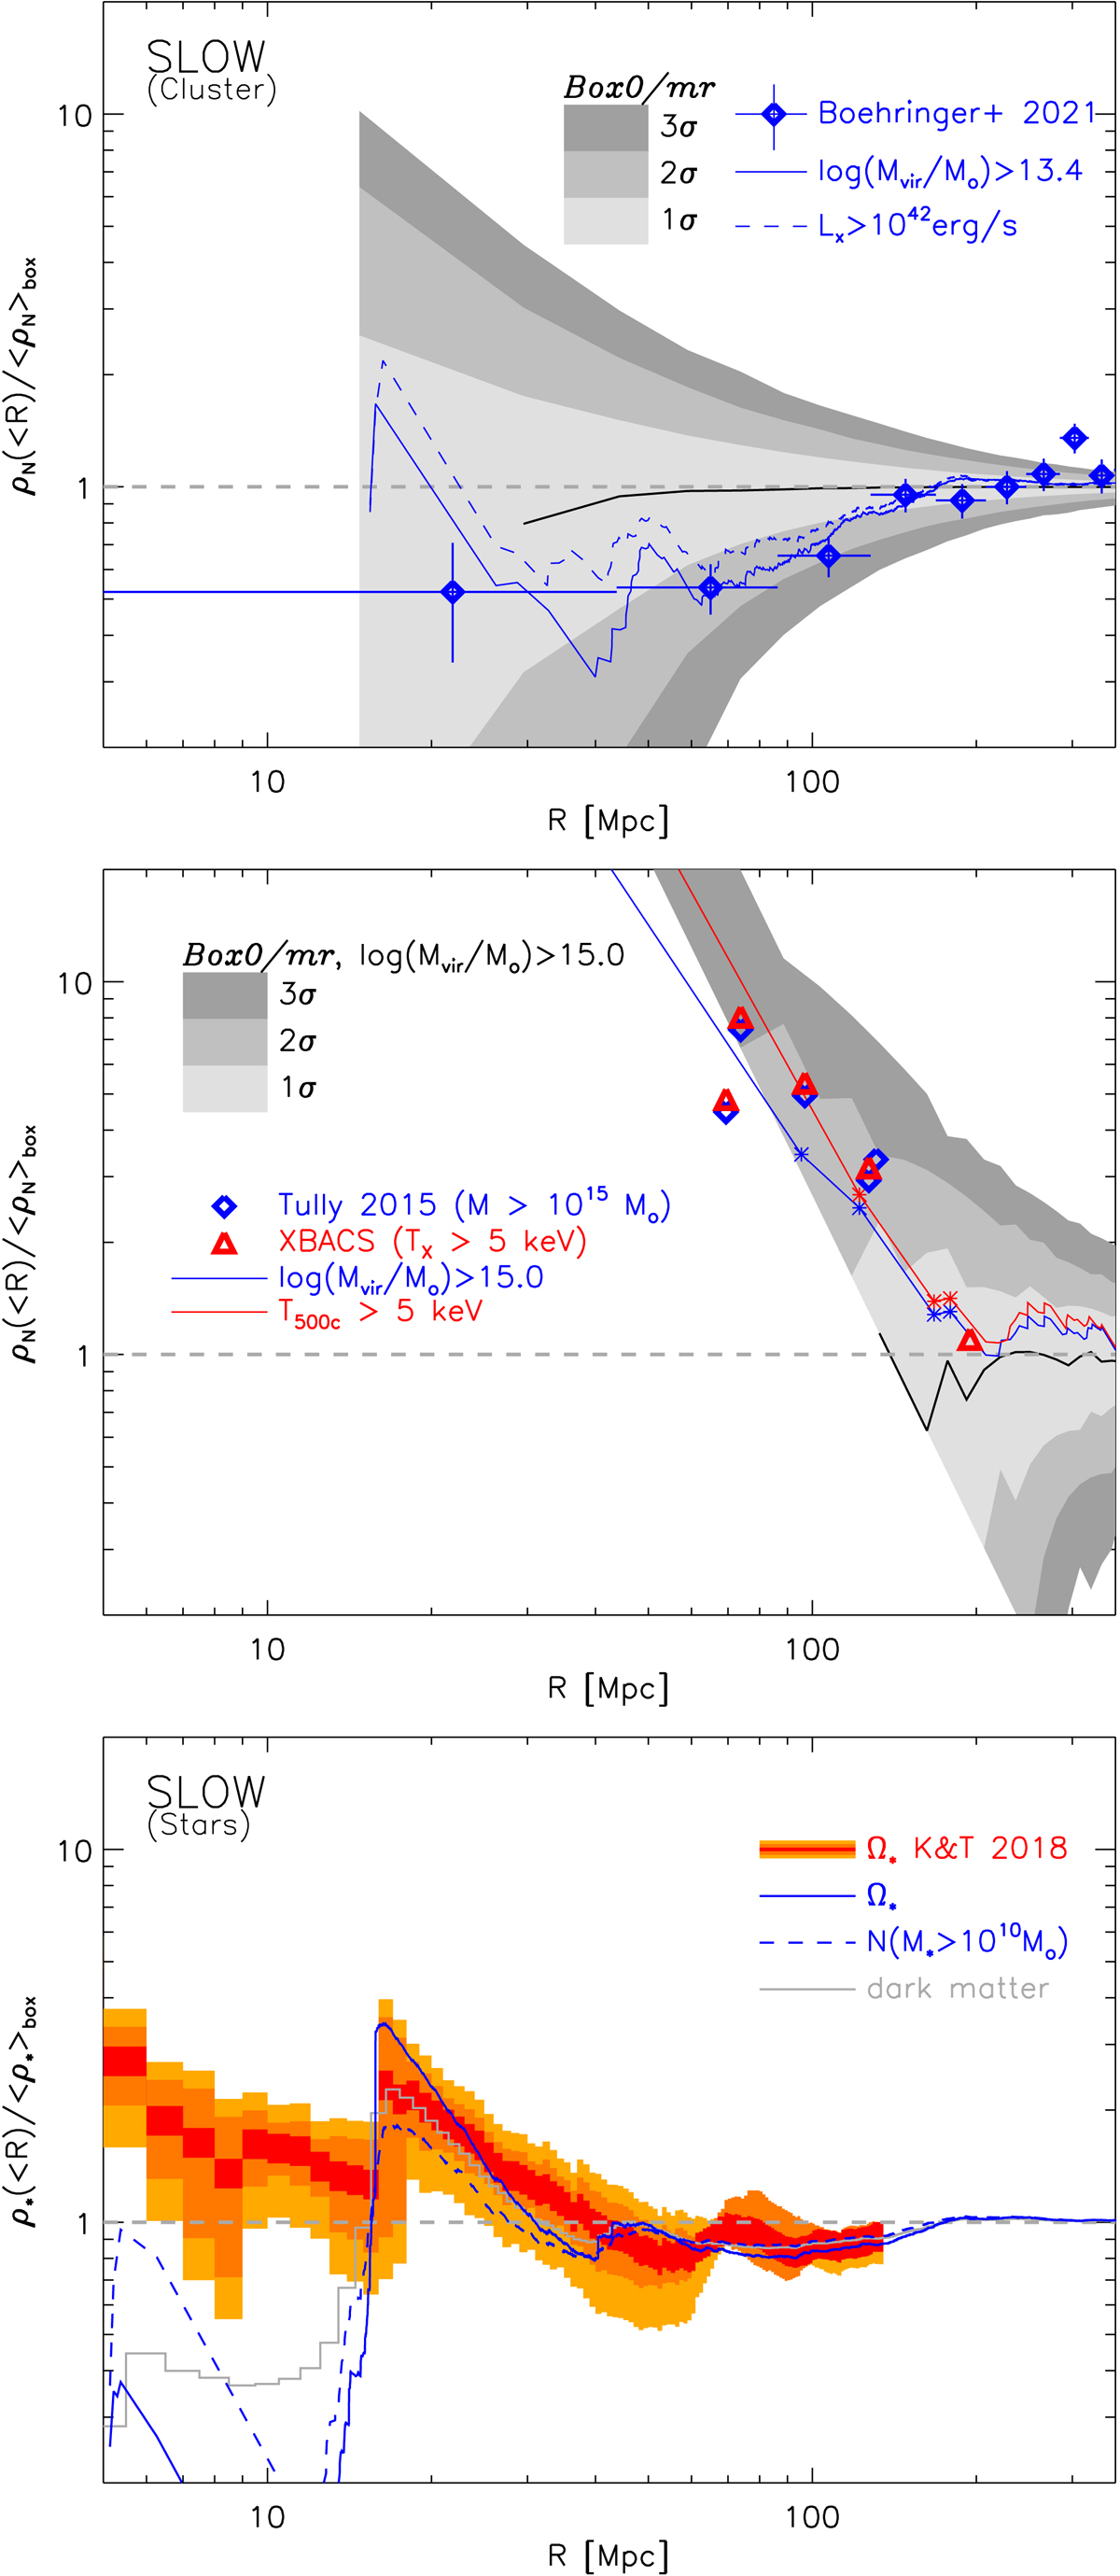
Cumulative relative density of halos and galaxies of different masses as a function of distance (computed from redshift) compared to different observations. Top panel: comparison of galaxy clusters to the X-ray sample from Böhringer et al. (2021), using the same mass cut (solid) and the same X-ray luminosity cut (dashed line). Middle panel: comparison of massive galaxy clusters (Mvir > ;1015 blue line, T500c > ;5 keV red line) to the five closest clusters exceeding this mass or temperature from the Tully catalog (Tully 2015) or the BAX database Sadat et al. (2004), respectively. Bottom panel: comparison of our simulated galaxies with the results on the stellar mass density presented in Karachentsev & Telikova (2018). In the upper two panels, the gray shaded regions indicate the 1, 2, and 3σ lines obtained from the Magneticum simulation and the black line indicates the median (to display the cosmic variance left).
Current usage metrics show cumulative count of Article Views (full-text article views including HTML views, PDF and ePub downloads, according to the available data) and Abstracts Views on Vision4Press platform.
Data correspond to usage on the plateform after 2015. The current usage metrics is available 48-96 hours after online publication and is updated daily on week days.
Initial download of the metrics may take a while.


