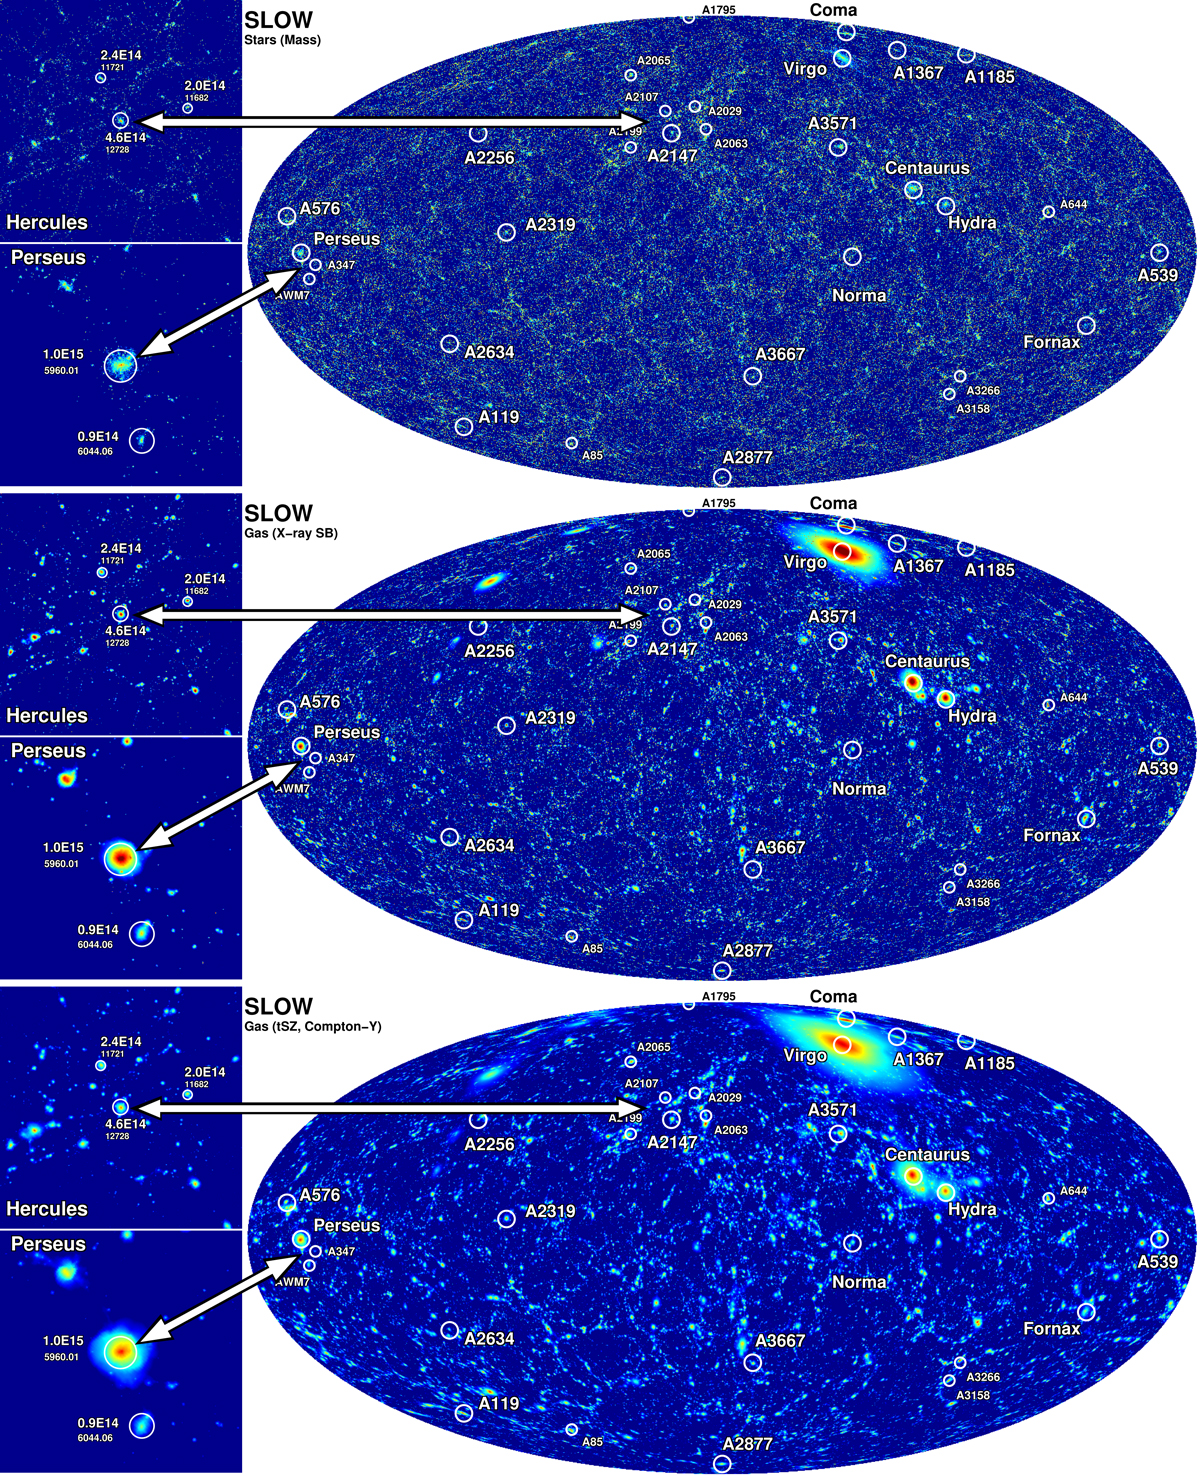
Fig. 4.

Download original image
SLOW in different wavebands. From top to bottom: distribution of stellar mass in SLOW, X-ray surface brightness, and Compton-Y. A much larger dynamic range than in the observations shown on Fig. 3 are used here for the color scaling to emphasize the large angular imprint on the very local galaxy clusters. The full simulation volume out to a distance of 350 Mpc is always shown. The insets show zoomed-in images of the Perseus and Hercules regions. Here a much narrower range around Perseus and A2147 is used (respectively 10 and 40 Mpc thick) to emphasize the local structures. The labels in the insets give the virial mass (in M⊙) of the halos, together with radial velocity (in km s−1) as redshift distance indicator.
Current usage metrics show cumulative count of Article Views (full-text article views including HTML views, PDF and ePub downloads, according to the available data) and Abstracts Views on Vision4Press platform.
Data correspond to usage on the plateform after 2015. The current usage metrics is available 48-96 hours after online publication and is updated daily on week days.
Initial download of the metrics may take a while.


