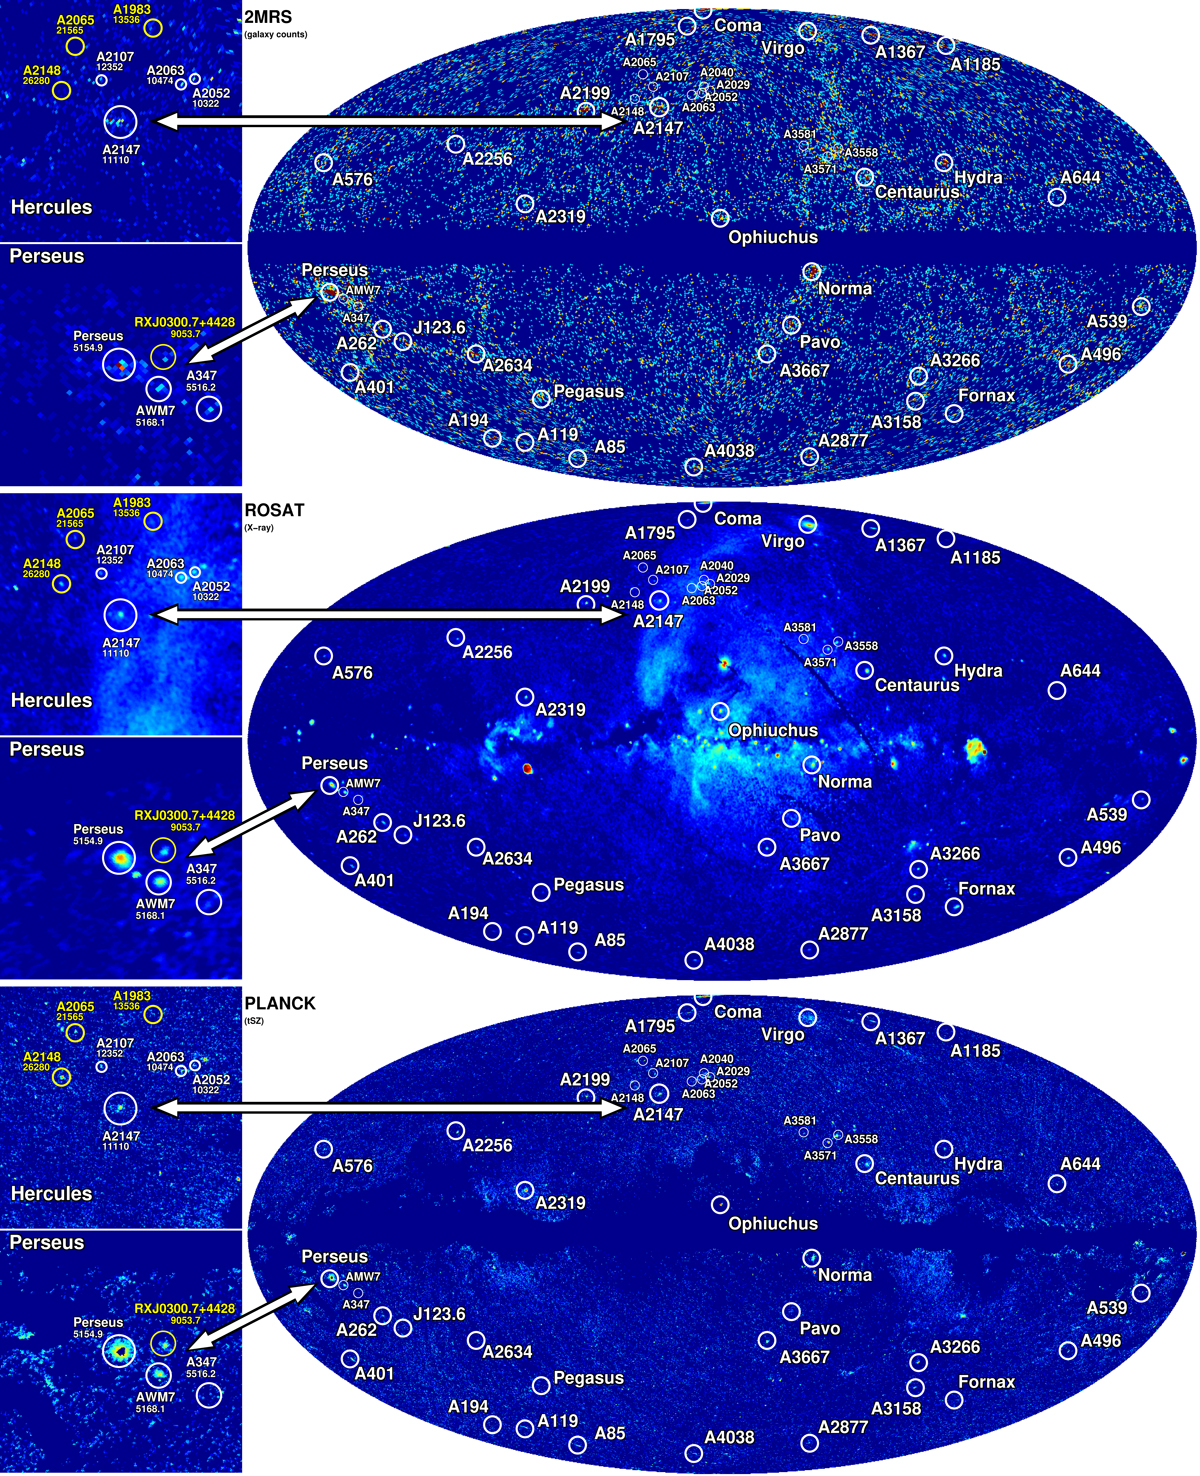
Fig. 3.

Download original image
Observations in different wavebands. From top to bottom: distribution of galaxies in the 2MRS catalog, X-ray surface brightness in the ROSAT 1.5 keV band (R6 + R7 = 0.76 − 2.04 keV), and Compton-Y map based on Planck data (produced with the MILCA algorithm Planck Collaboration XXII 2016) with the CO mask by Khatri (2016). The insets show zoomed-in images of the Perseus and Hercules regions. The labels in the insets give the Name together with radial velocity (in km s−1) as redshift distance indicator. The yellow labels indicate clusters that are outside the slice used in the simulations shown in Fig. 4.
Current usage metrics show cumulative count of Article Views (full-text article views including HTML views, PDF and ePub downloads, according to the available data) and Abstracts Views on Vision4Press platform.
Data correspond to usage on the plateform after 2015. The current usage metrics is available 48-96 hours after online publication and is updated daily on week days.
Initial download of the metrics may take a while.


