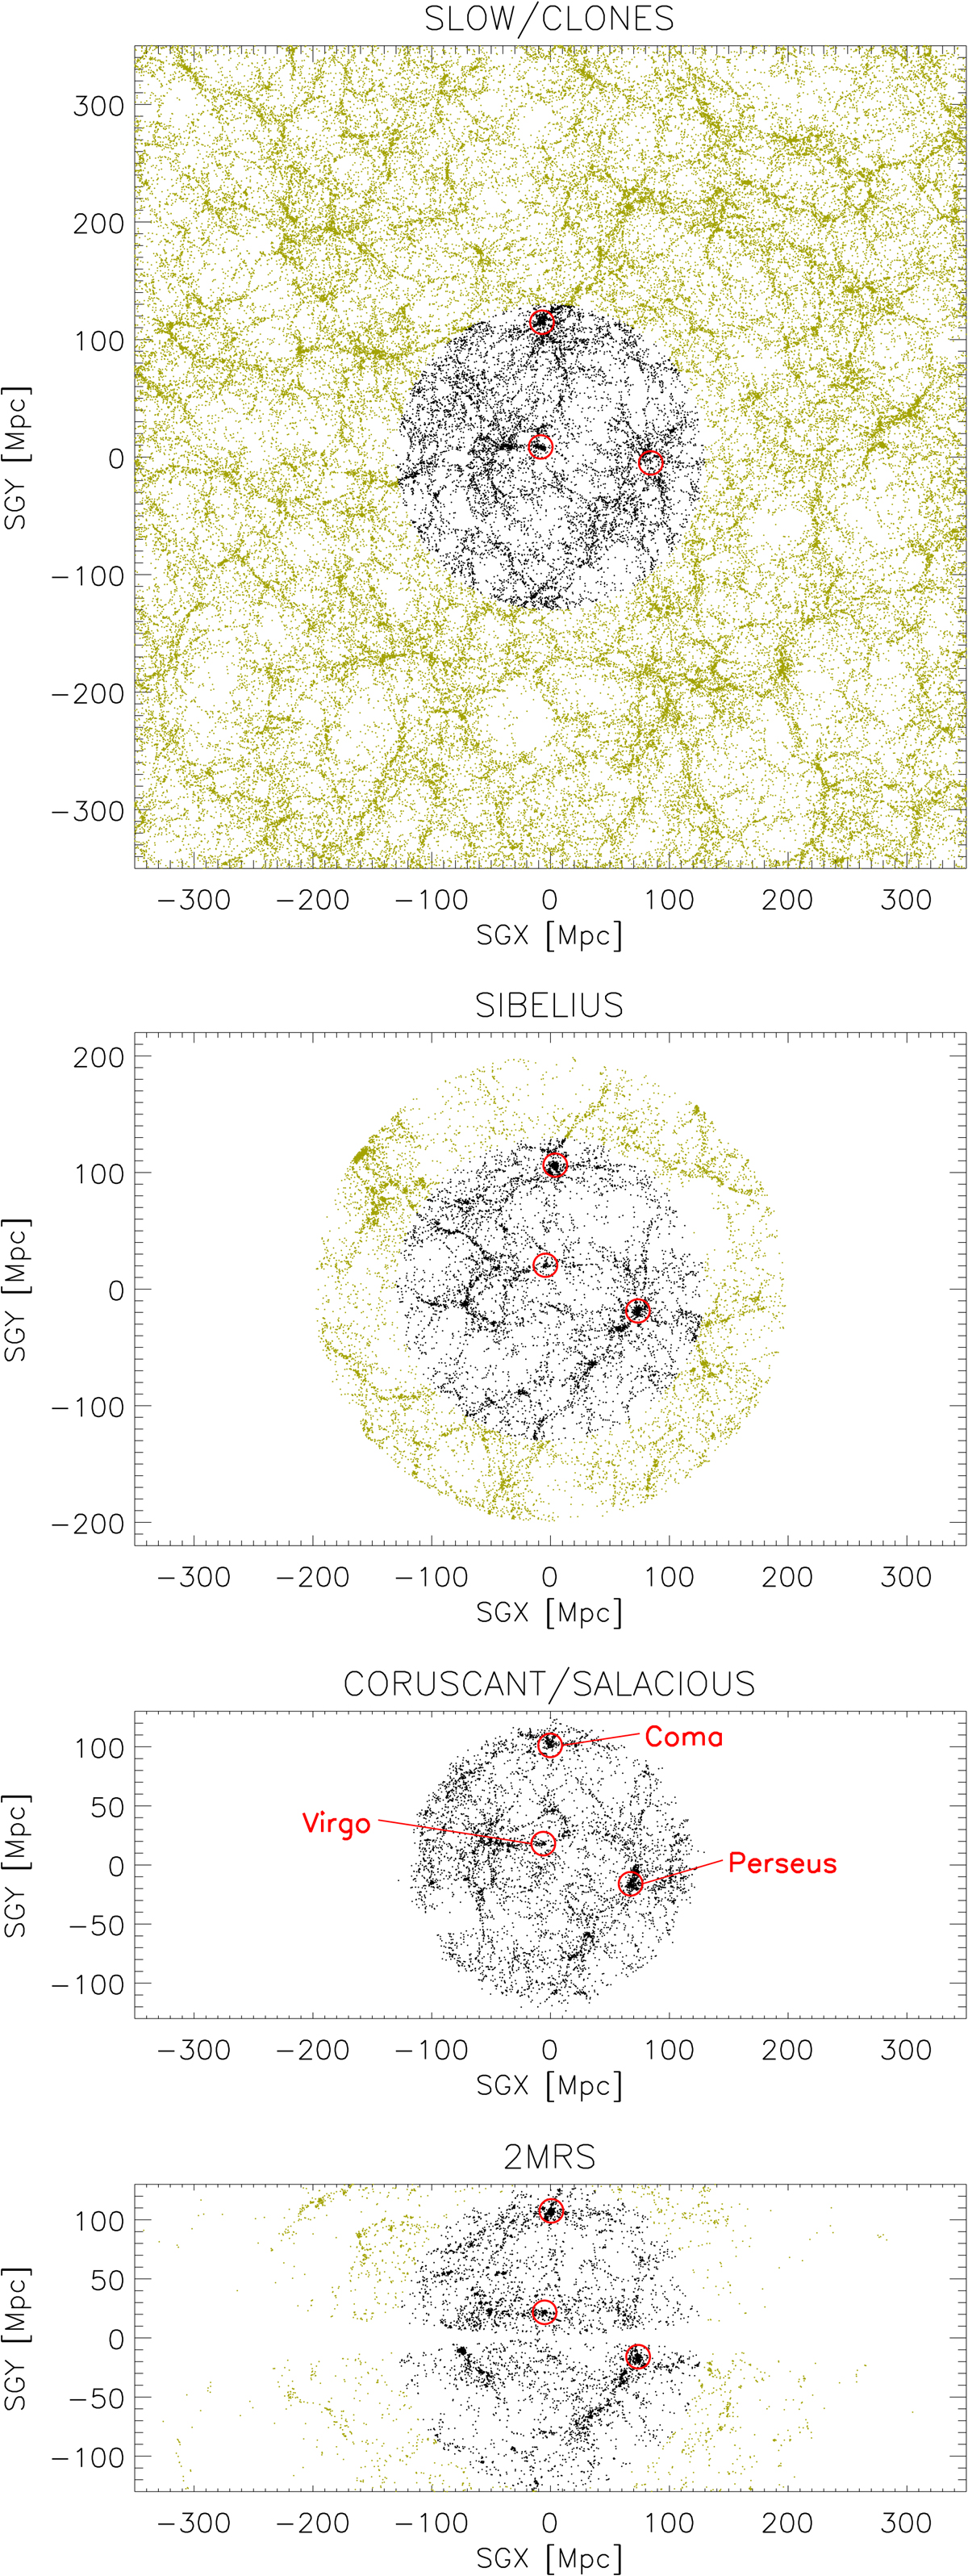
Fig. 1.

Download original image
Positions in supergalactic x/y coordinates of all galaxies in the simulations, compared to galaxies from the 2MRS catalog. To make the simulations comparable, the galaxies are restricted to stellar masses above 1010 M⊙ within a 50 Mpc thick slice around the center of the simulation volume. A lighter color means galaxies more distant than 130 Mpc. For the observation, only galaxies with log(LK) > 10.25 are plotted to match the mass cut. In addition, the positions of Coma, Virgo, and Perseus are labeled. The virial masses of the halos in the simulations are listed in Table 1. From top to bottom: SLOW, SIBELIUS, CORUSCANT, and 2MRS.
Current usage metrics show cumulative count of Article Views (full-text article views including HTML views, PDF and ePub downloads, according to the available data) and Abstracts Views on Vision4Press platform.
Data correspond to usage on the plateform after 2015. The current usage metrics is available 48-96 hours after online publication and is updated daily on week days.
Initial download of the metrics may take a while.


