Fig. 7
Download original image
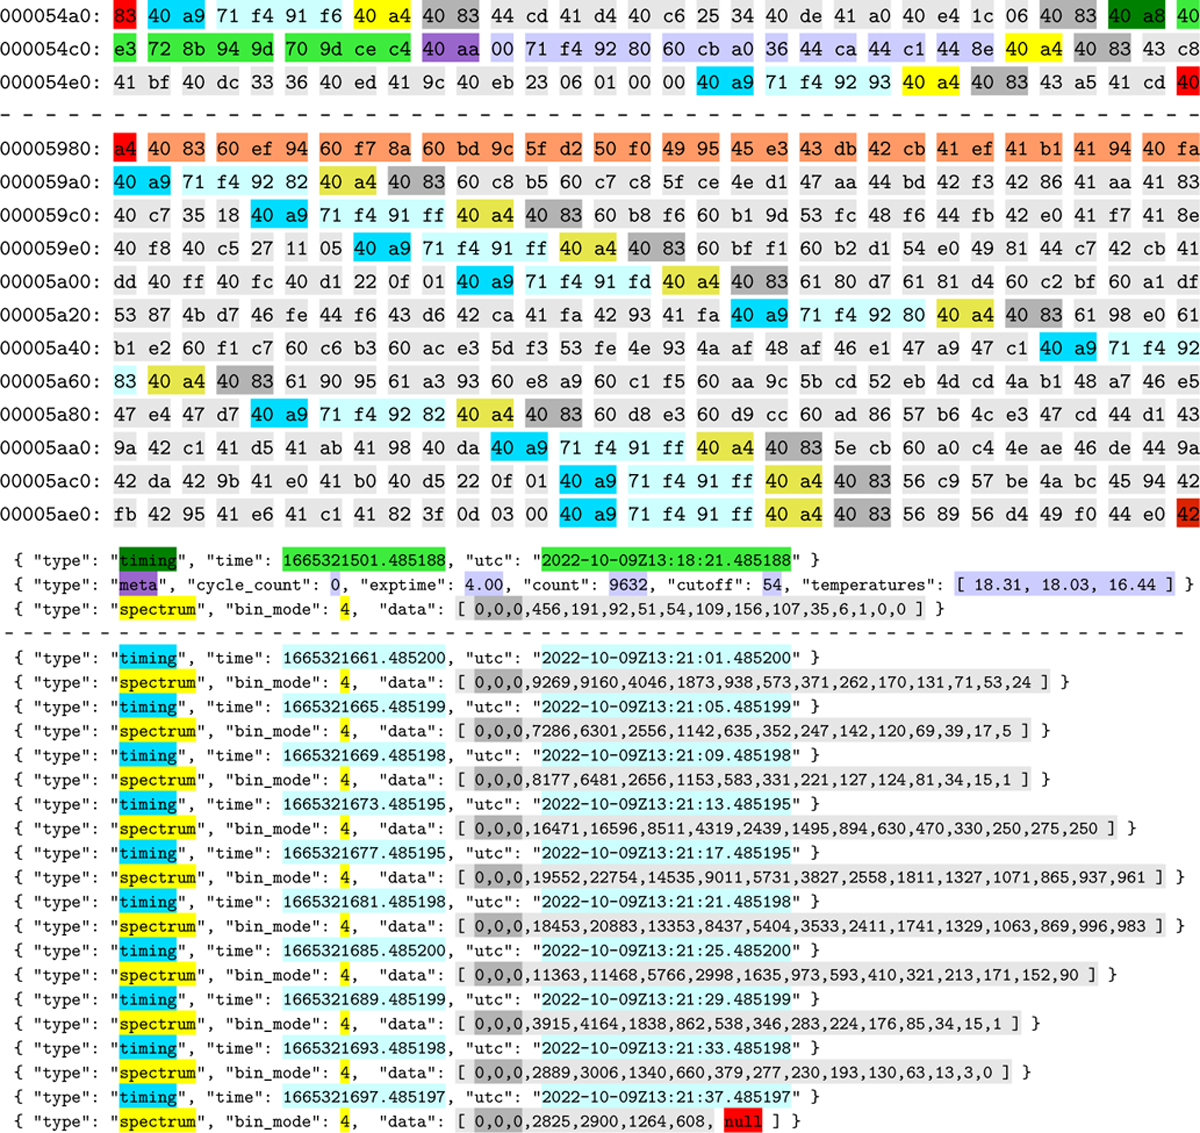
Scientific telemetry streams from GRBAlpha in raw format (upper panel) and decoded format (lower panel, displayed in the form of hierarchical JSON objects and arrays). The corresponding blocks are highlighted accordingly: absolute time instances are highlighted in green, relative time synchronization values are highlighted in blue, data acquisition metadata and housekeeping blocks are purple, spectral measurements are yellow and light gray. Bytes that are out of stream-level synchronization are highlighted with dark red while blocks are out of block-level synchronization are highlighted with orange. The trailing byte is also highlighted as red, denoting a stray byte (however, the full block can also be partially decoded, as it is clear from the JSON form). The data displayed correspond to the second peak of the GRB 221009A event, see also the respective timestamps. Note also that relative timestamps are converted to absolute time instances during the decoding.
Current usage metrics show cumulative count of Article Views (full-text article views including HTML views, PDF and ePub downloads, according to the available data) and Abstracts Views on Vision4Press platform.
Data correspond to usage on the plateform after 2015. The current usage metrics is available 48-96 hours after online publication and is updated daily on week days.
Initial download of the metrics may take a while.