Fig. A.1.
Download original image
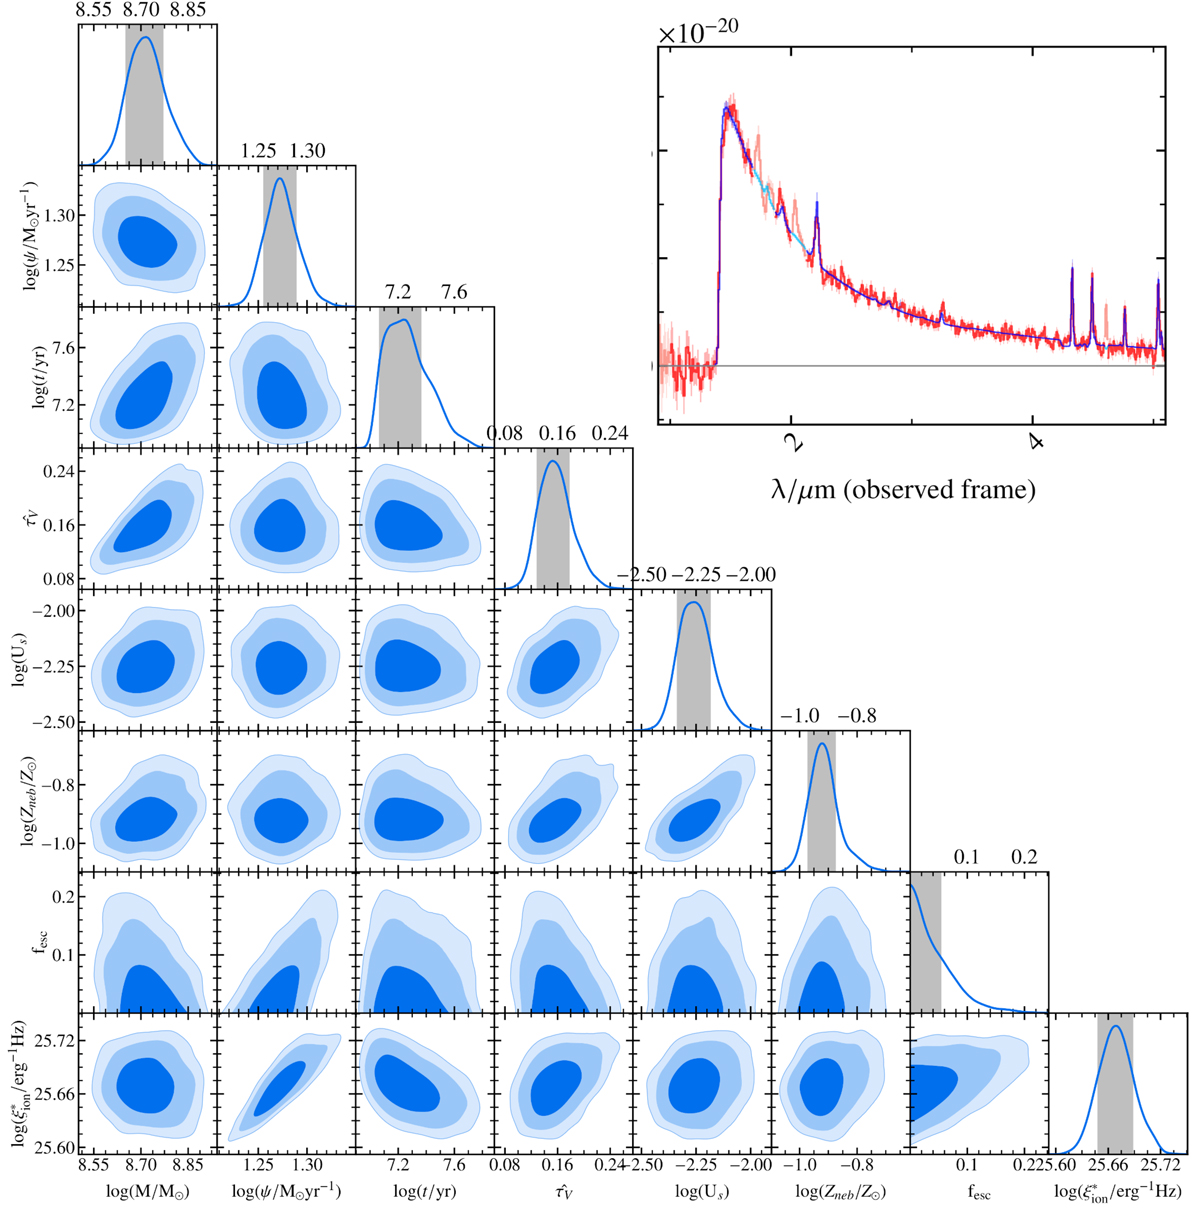
Triangle plot showing the 2D (1D on the diagonal) posterior probability distributions for the derived stellar mass (M; accounting for mass returned to the ISM through stellar winds and supernova explosions), star formation rate (ψ), maximum age of the stars (t), effective V-band attenuation optical depth (![]() = AV/1.086), ionisation parameter (log10US), nebular metallicity (Zneb), escape fraction of H-ionising photons (fesc), and ionising photon production efficiency (ξion). The contours in the 2D posterior plots show the 1, 2, and 3σ credible regions in dark, medium, and light blue, respectively. The inset shows the resulting fit to the prism spectrum, with the spectrum and 1σ standard errors shown as the red line and shaded region, respectively, and the 1σ range of fitted model spectra in blue. Regions that are masked in the spectrum are shown as fainter red (data) and fainter blue (model) shaded regions.
= AV/1.086), ionisation parameter (log10US), nebular metallicity (Zneb), escape fraction of H-ionising photons (fesc), and ionising photon production efficiency (ξion). The contours in the 2D posterior plots show the 1, 2, and 3σ credible regions in dark, medium, and light blue, respectively. The inset shows the resulting fit to the prism spectrum, with the spectrum and 1σ standard errors shown as the red line and shaded region, respectively, and the 1σ range of fitted model spectra in blue. Regions that are masked in the spectrum are shown as fainter red (data) and fainter blue (model) shaded regions.
Current usage metrics show cumulative count of Article Views (full-text article views including HTML views, PDF and ePub downloads, according to the available data) and Abstracts Views on Vision4Press platform.
Data correspond to usage on the plateform after 2015. The current usage metrics is available 48-96 hours after online publication and is updated daily on week days.
Initial download of the metrics may take a while.