Fig. 8.
Download original image
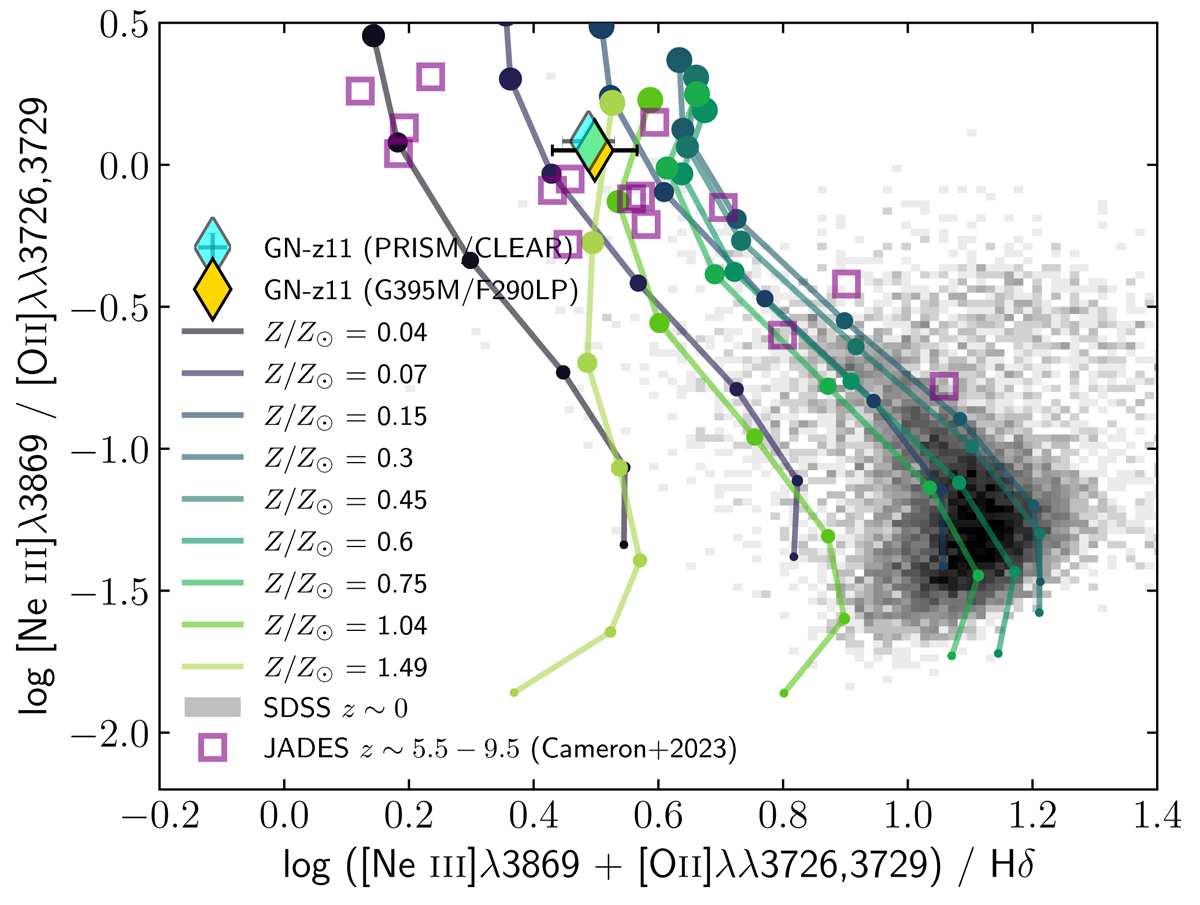
Line ratio diagram, showing ([Ne III]+[O II])/Hδ versus [Ne III]/[O II], featuring GN-z11. The yellow diamond denotes the line ratios derived from the medium-dispersion G395M grating, and the cyan diamond uses the low-dispersion prism spectrum (where we have corrected for the blending of [Ne III] λ3869 with He Iλ3889 using the flux ratio from the grating). The background grey 2D probability density function shows the subset of SDSS galaxies with 0.03 < z < 0.1 for which [Ne III] λ3869, [O II] λλ3726, 3729, and Hδ are all detected with S/N > 5. Purple squares show z > 5.5 galaxies from Cameron et al. (2023) after adjusting the reported ratios to be in terms of Hδ by assuming a fixed value of Hδ/Hβ = 0.268. Solid lines show model grids from Gutkin et al. (2016), plotted for nine different values of metallicity (Z/Z⊙ = 0.04, 0.07, 0.15, 0.30, 0.45, 0.60, 0.75, 1.0, 1.5), as indicated by the different colours, and seven values of the ionisation parameter, indicated by marker sizes, in steps of 0.5 from log10U = −4.0 (smallest) to log10U = −1.0 (largest).
Current usage metrics show cumulative count of Article Views (full-text article views including HTML views, PDF and ePub downloads, according to the available data) and Abstracts Views on Vision4Press platform.
Data correspond to usage on the plateform after 2015. The current usage metrics is available 48-96 hours after online publication and is updated daily on week days.
Initial download of the metrics may take a while.