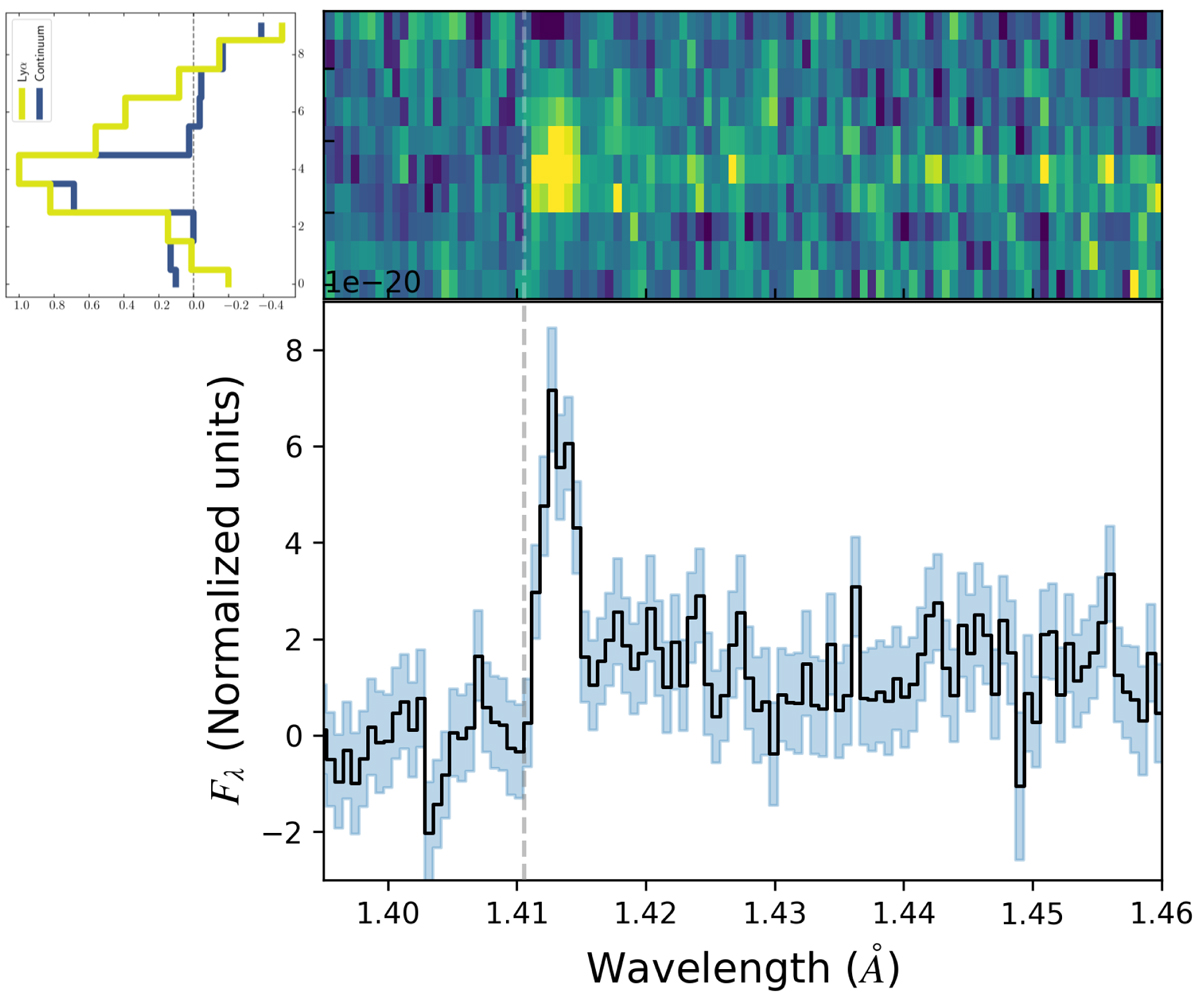
Fig. 6.
Download original image
Zoom in on the Lyα emission line in the G140M 1D (lower) and 2D (upper) spectra. The dashed grey line shows the systemic wavelength of the Lyα transition. The histograms (top left) of the Lyα spatial profile (yellow) and that of the continuum (blue) show the Lyα emission from GN-z11 is more extended towards the south-west (up in the MSA shutter in this view).
Current usage metrics show cumulative count of Article Views (full-text article views including HTML views, PDF and ePub downloads, according to the available data) and Abstracts Views on Vision4Press platform.
Data correspond to usage on the plateform after 2015. The current usage metrics is available 48-96 hours after online publication and is updated daily on week days.
Initial download of the metrics may take a while.