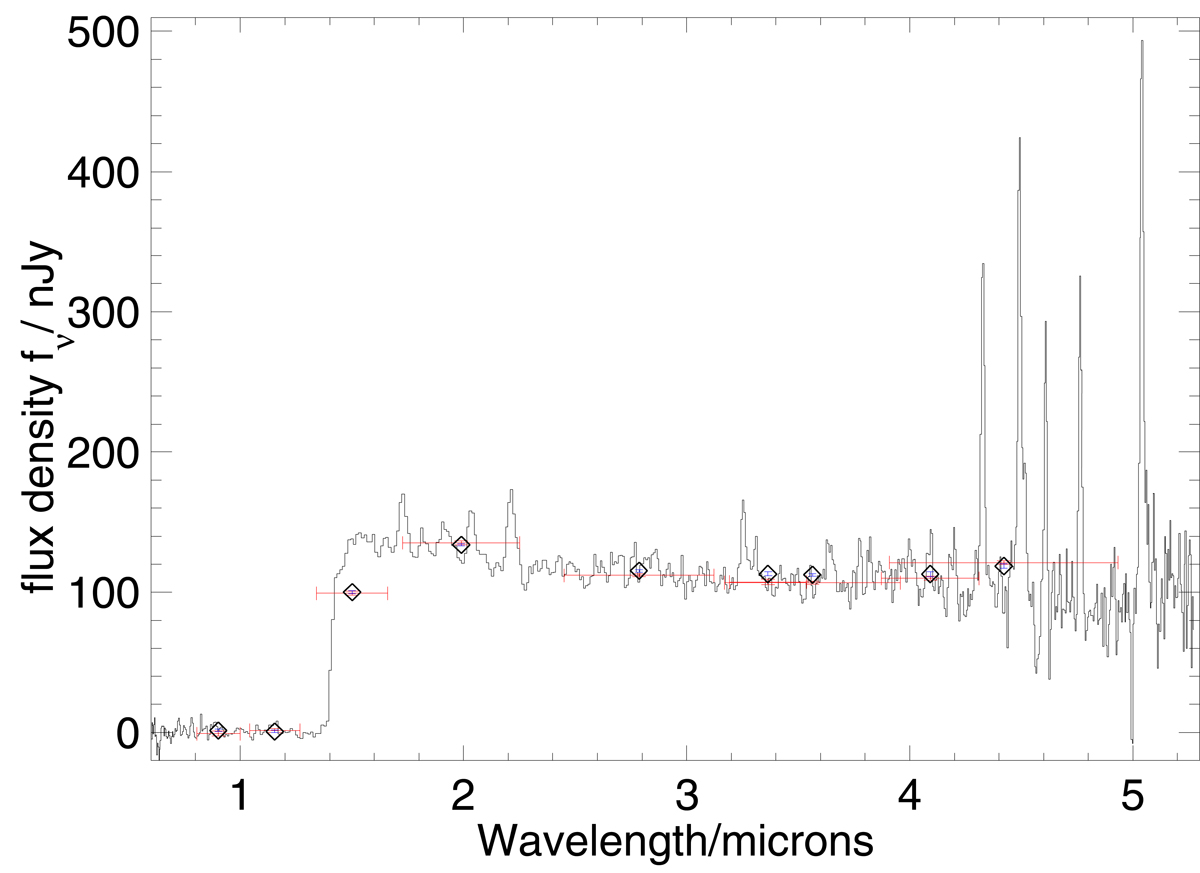
Fig. C.1.
Download original image
NIRSpec low-dispersion prism spectrum of GN-z11 (3-pixel extraction), compared with the NIRCam photometry in different filters (red error bars denote the flux uncertainty and the wavelength span of the filter bandpass). The large diamond symbols denote the flux from the NIRSpec spectrum integrated over the filter response curve, with the small blue error bars within these diamond symbols.
Current usage metrics show cumulative count of Article Views (full-text article views including HTML views, PDF and ePub downloads, according to the available data) and Abstracts Views on Vision4Press platform.
Data correspond to usage on the plateform after 2015. The current usage metrics is available 48-96 hours after online publication and is updated daily on week days.
Initial download of the metrics may take a while.