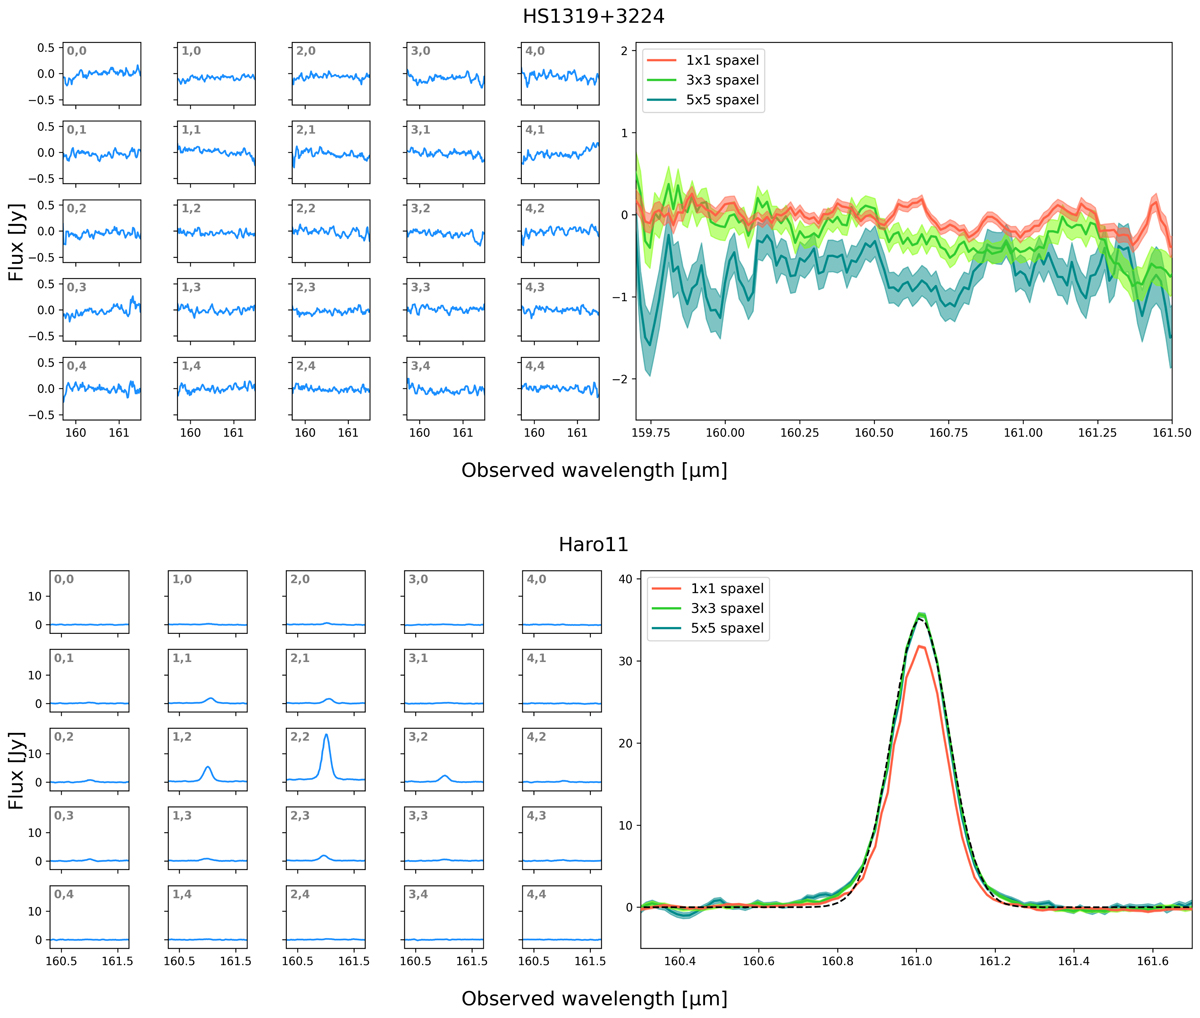
Fig. A.1.
Download original image
Examples of spectra extraction for two galaxies with bad (top) and good (bottom) quality of the [CII] data. For both galaxies: Left panel shows [CII] spectra obtained for each spaxel of the PACS data cube (with the pair numbers in the top left of each plot associated with the corresponding position on the PACS footprint); in the right panel, the solid lines represent the spectra from the central spaxel (orange) and from the inner 3 × 3 (green) and 5 × 5 (teal) spaxel grids, while the shaded areas show their uncertainties. For Haro11, the right panel reports the continuum-subtracted spectra, while the dashed black line displays the single component Gaussian fit on the 3 × 3 inner spectrum.
Current usage metrics show cumulative count of Article Views (full-text article views including HTML views, PDF and ePub downloads, according to the available data) and Abstracts Views on Vision4Press platform.
Data correspond to usage on the plateform after 2015. The current usage metrics is available 48-96 hours after online publication and is updated daily on week days.
Initial download of the metrics may take a while.