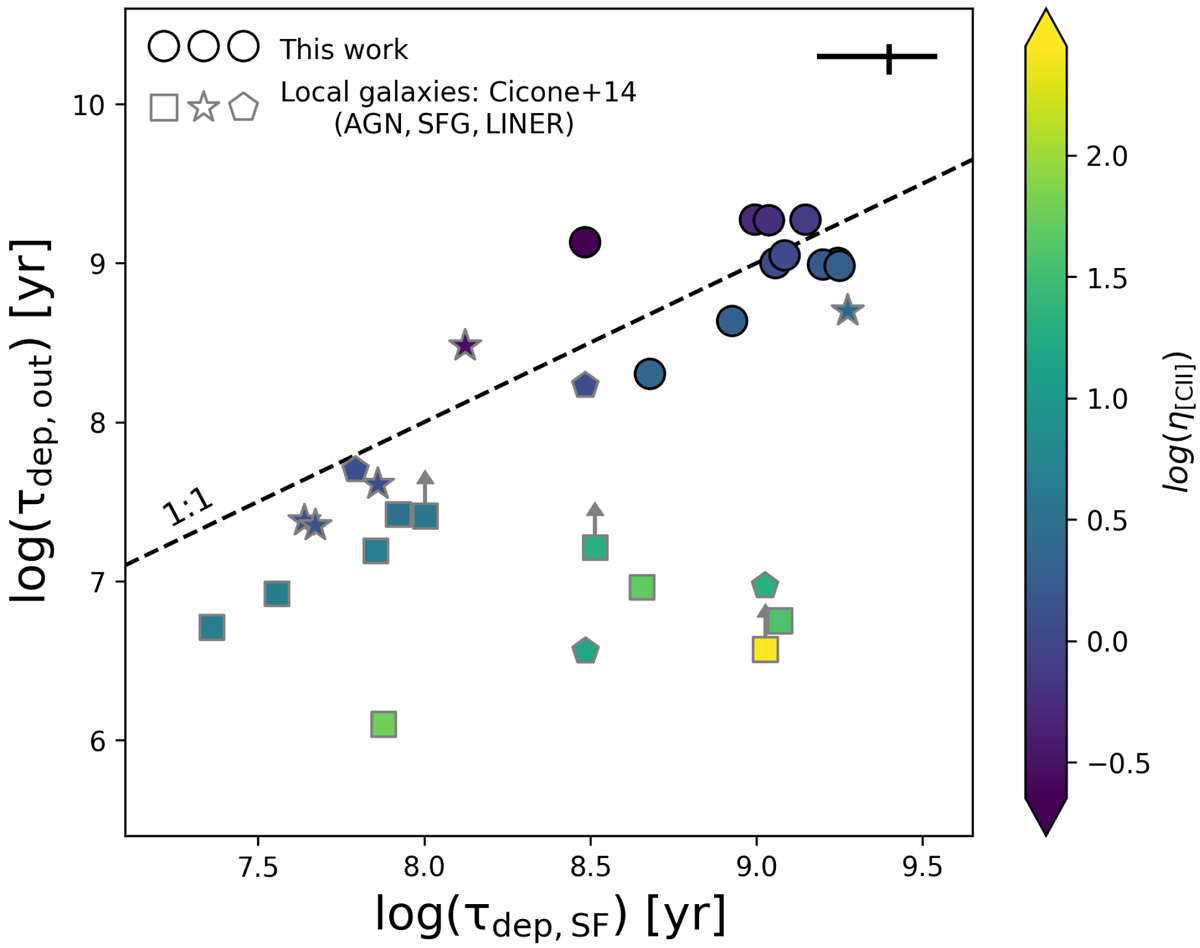
Fig. 7.
Download original image
Comparison between depletion timescale due to outflows and gas consumption due to star formation. DGS galaxies from this work are shown as circles. The typical uncertainty on both timescales is shown in the top right corner. Squares, stars, and pentagons are the results from local AGNs, starburst galaxies, and LINERs, respectively (Cicone et al. 2014). The dashed line reports the 1:1 relation. The area below this line is populated by galaxies whose outflows are more efficient than star formation in consuming gas (i.e., τdep, out < τdep, SF). All data are color-coded for their mass-loading factors.
Current usage metrics show cumulative count of Article Views (full-text article views including HTML views, PDF and ePub downloads, according to the available data) and Abstracts Views on Vision4Press platform.
Data correspond to usage on the plateform after 2015. The current usage metrics is available 48-96 hours after online publication and is updated daily on week days.
Initial download of the metrics may take a while.