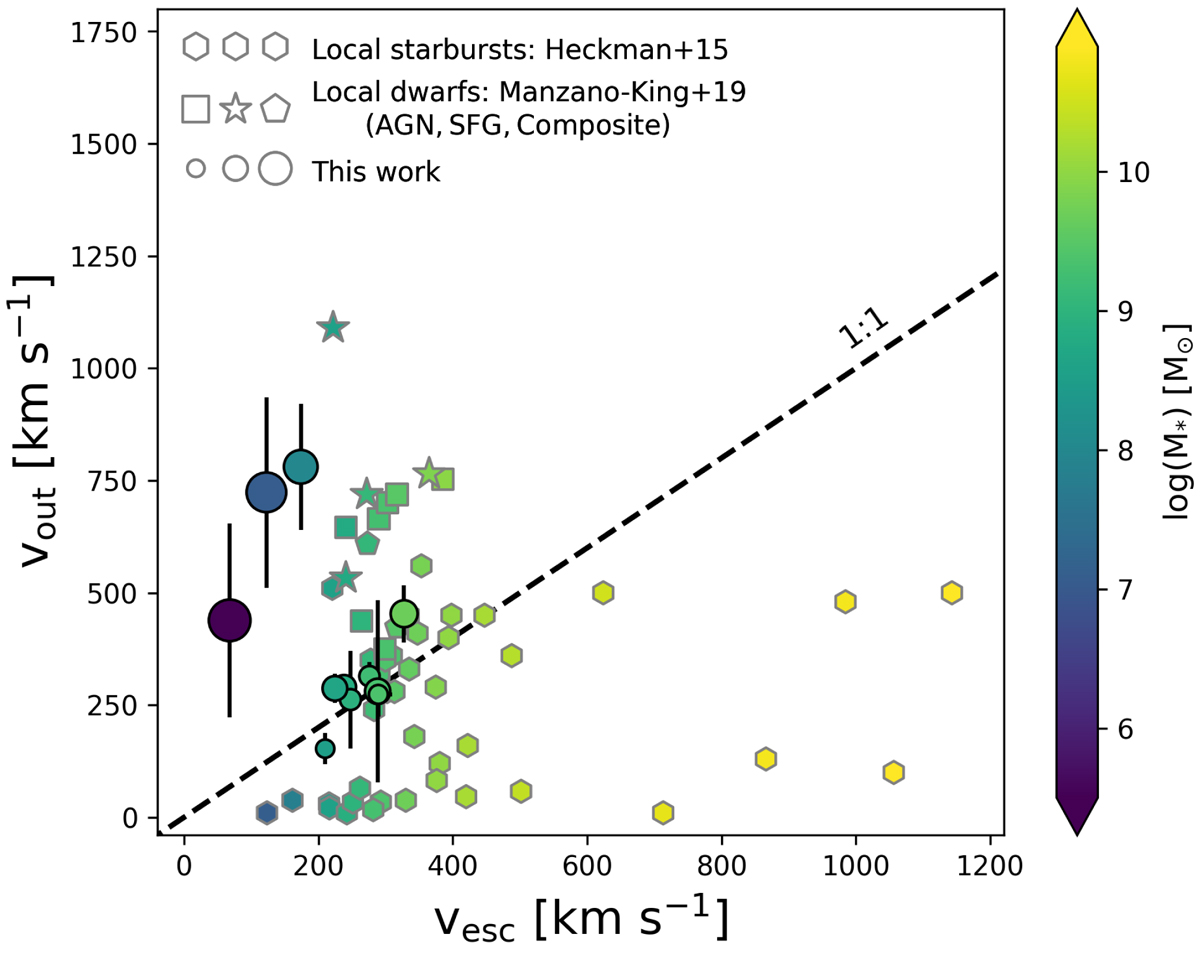
Fig. 6.
Download original image
Relation between outflow velocity and escape velocity. Galaxies of our sample with individual outflow detections are shown as circles with their size increasing with larger escape fractions. Local starbursts are represented as hexagons (Heckman et al. 2015). Nearby dwarf galaxies, including AGNs and star forming and composite galaxies (based on their optical classification), are shown as squares, stars, and pentagons, respectively (Manzano-King et al. 2019). The dashed line reports the 1:1 relation. All data are color-coded for their stellar mass.
Current usage metrics show cumulative count of Article Views (full-text article views including HTML views, PDF and ePub downloads, according to the available data) and Abstracts Views on Vision4Press platform.
Data correspond to usage on the plateform after 2015. The current usage metrics is available 48-96 hours after online publication and is updated daily on week days.
Initial download of the metrics may take a while.