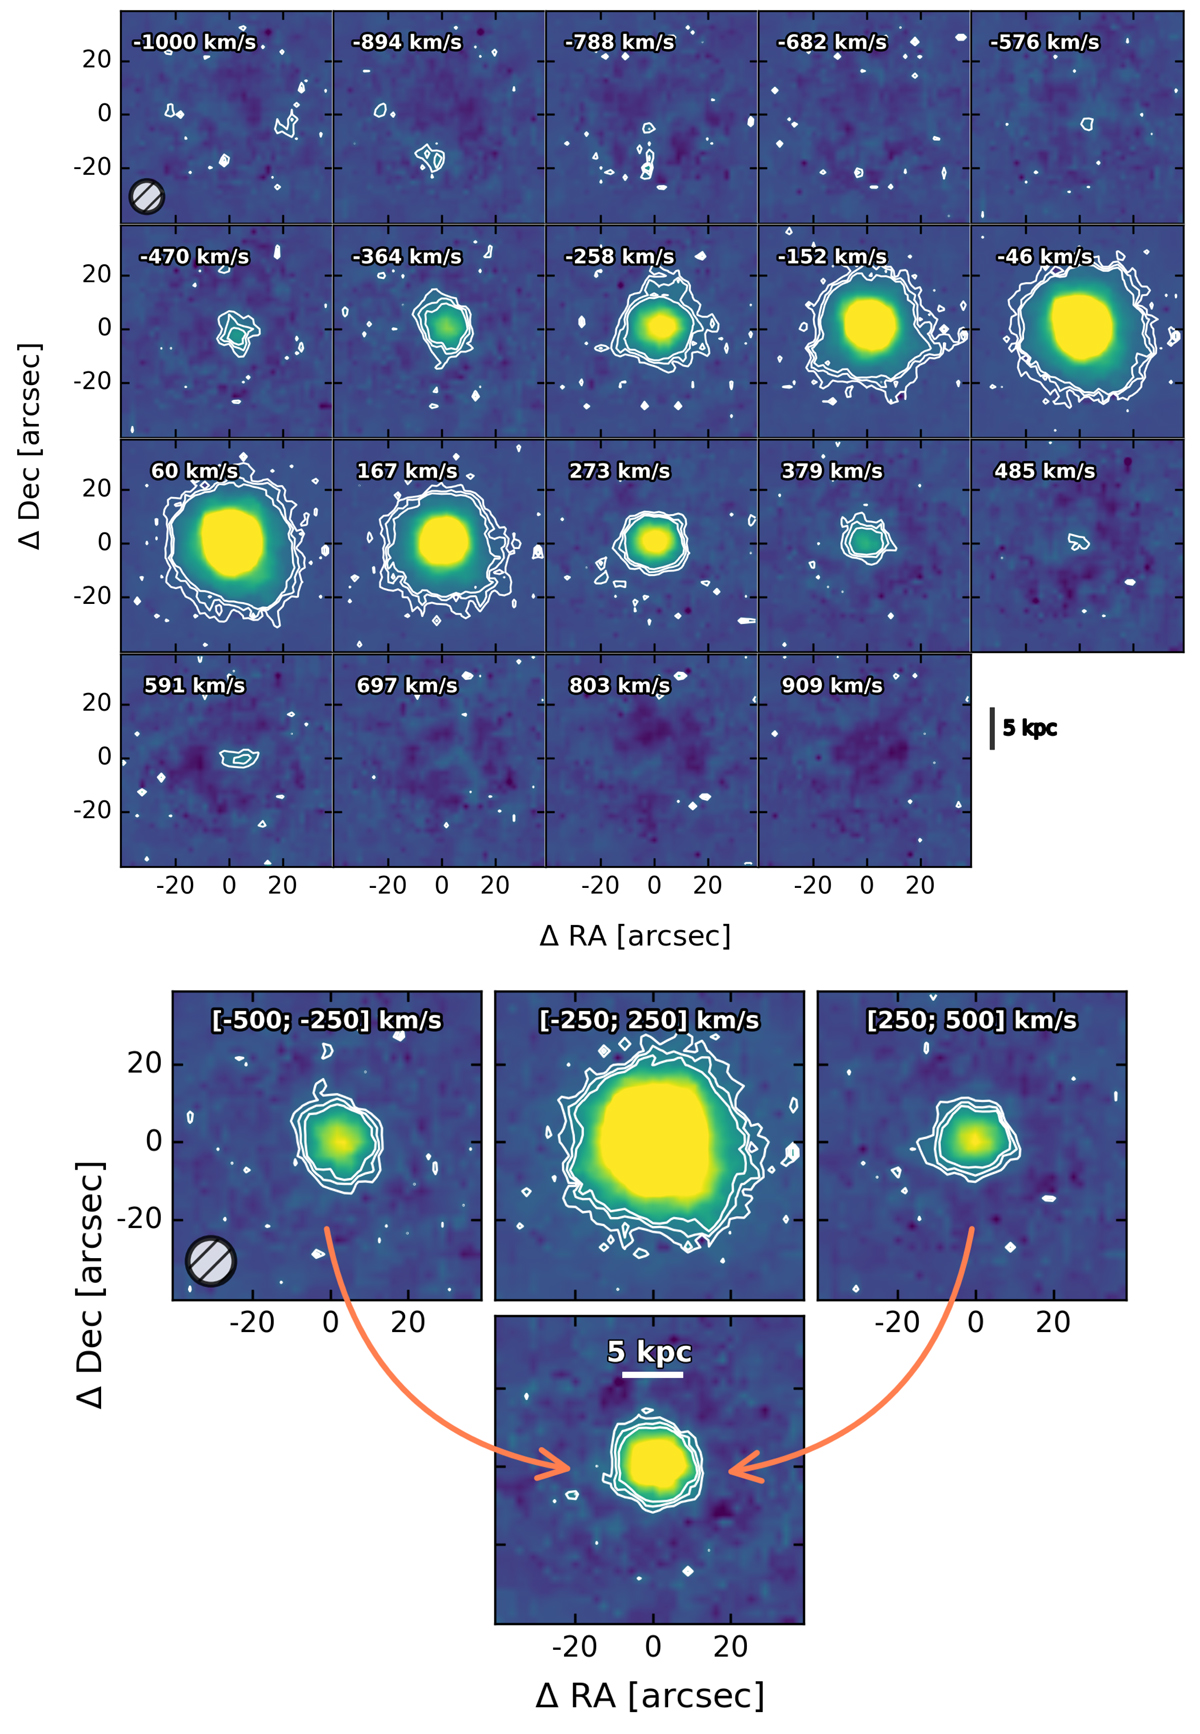
Fig. 4.
Download original image
Spatial extent of the average [CII] emission. Top: Channel maps of the stacked cube covering ∼2000 km s−1 around the peak of the emission line. Velocity bins are in steps of ∼106 km s−1 for a better representation. Each spectral channel shows the [CII] emission from a 80″ × 80″ region. Contour levels are shown in white at 3, 5, and 7σ, where σ is the rms computed in each channel. Bottom: [CII] integrated intensity maps of the outflow and core emission. Left and right panels are obtained by summing the emission of the broad wings in the velocity ranges [−500, −250] and [250; 500] km s−1, respectively, while the central panel represents the core emission at [−250; 250] km s−1. The bottom panel is the sum of the two velocity-integrated maps of the broad wings (as pointed out by the arrows) representing the whole outflow emission. Contour levels are shown in white at 3, 5, and 7 σ, where σ is the rms of the integrated intensity map. Both figures report the PACS beam (as shown in the lower-left corner of the first panel) and a reference scale of 5 kpc.
Current usage metrics show cumulative count of Article Views (full-text article views including HTML views, PDF and ePub downloads, according to the available data) and Abstracts Views on Vision4Press platform.
Data correspond to usage on the plateform after 2015. The current usage metrics is available 48-96 hours after online publication and is updated daily on week days.
Initial download of the metrics may take a while.