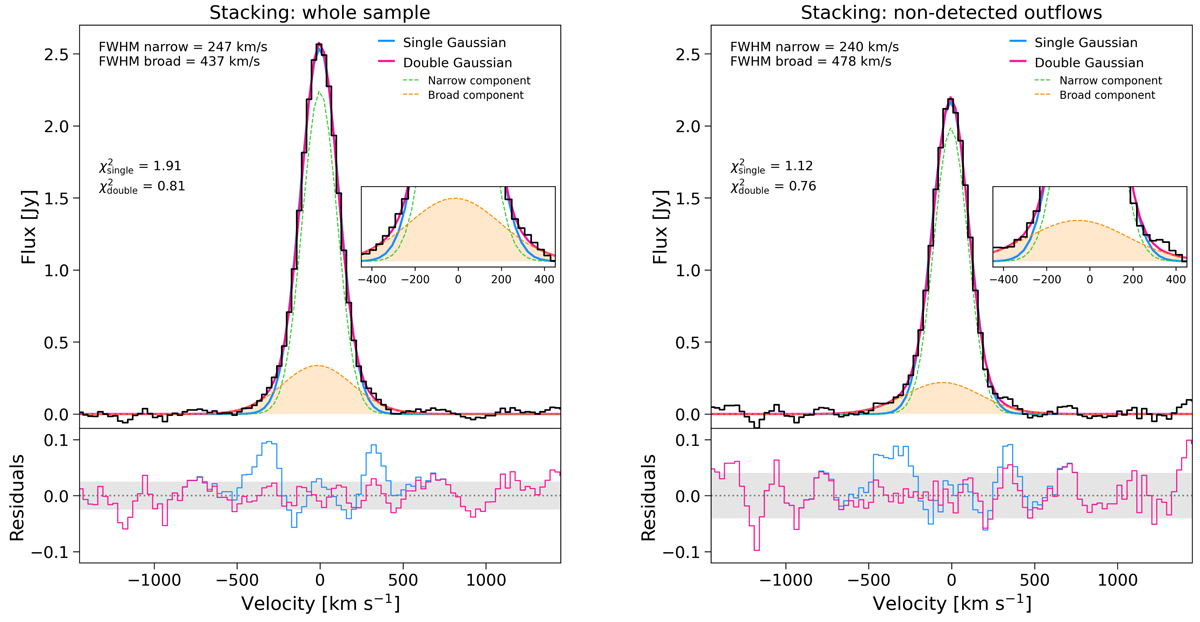
Fig. 3.
Download original image
Average [CII] line profiles. Left: Stacked, variance-weighted [CII] spectrum (black histogram) of the whole sample as a function of velocity. Both the fit with a single Gaussian function (in blue) and that with a double Gaussian profile (in pink) are reported. The latter is the sum of a narrow (green line) and broad (orange line and shaded area) component. The FWHM of both components and the corresponding reduced χ2 are also shown in the figure. A zoomed-in view of the spectral region dominated by outflows is shown as an inset plot on the right. The bottom panel reports the residuals from the single (blue) and double (pink) Gaussian functions. The dotted horizontal line marks the zero level, while the shaded area represents the noise of each spectrum at ±1σ, computed as described in the text. Right: Same as left panel, but for the stacking of only the sources with non-detected outflows.
Current usage metrics show cumulative count of Article Views (full-text article views including HTML views, PDF and ePub downloads, according to the available data) and Abstracts Views on Vision4Press platform.
Data correspond to usage on the plateform after 2015. The current usage metrics is available 48-96 hours after online publication and is updated daily on week days.
Initial download of the metrics may take a while.