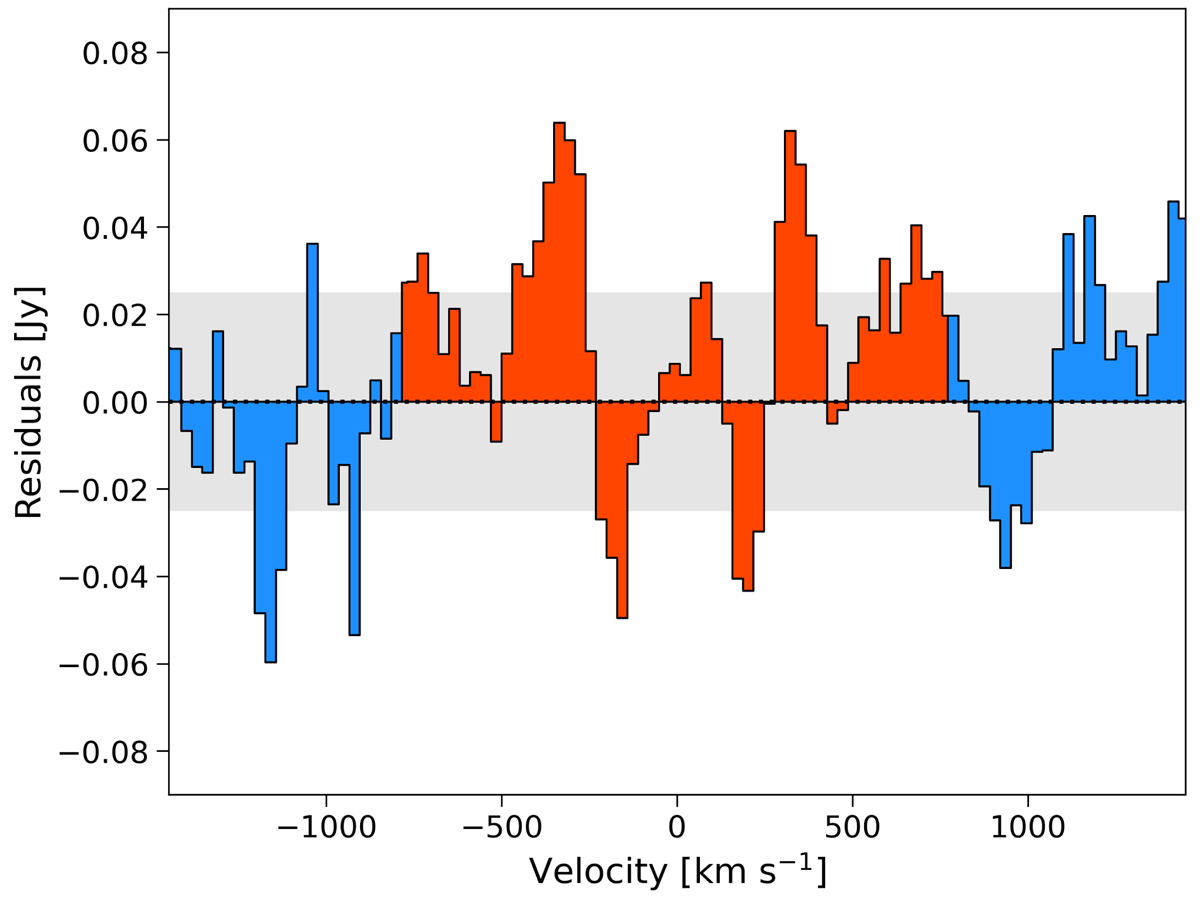
Fig. 2.
Download original image
Variance-weighted stacked residuals obtained after subtracting the best-fit single component Gaussian function to each [CII] spectrum. Red bins represent the residuals within ±800 km s−1, whereas the blue bins mark the spectral region used for estimating the noise. The dotted horizontal line sets the zero level, while the shaded area represents the noise at ±1σ. An ∼3σ excess is visible at velocities ±400 km s−1, suggesting that a further Gaussian component is needed to model the [CII] emission in our galaxies.
Current usage metrics show cumulative count of Article Views (full-text article views including HTML views, PDF and ePub downloads, according to the available data) and Abstracts Views on Vision4Press platform.
Data correspond to usage on the plateform after 2015. The current usage metrics is available 48-96 hours after online publication and is updated daily on week days.
Initial download of the metrics may take a while.