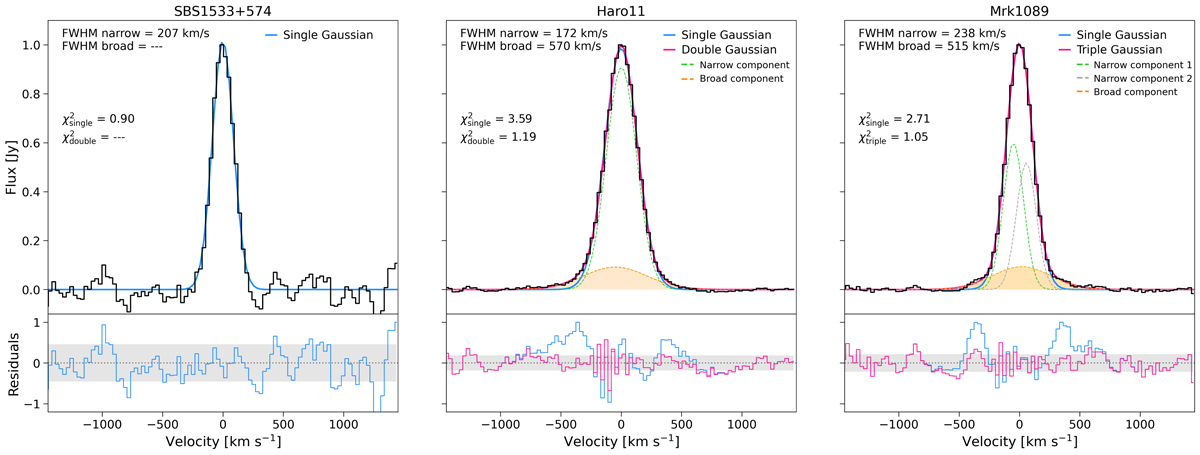
Fig. B.1.
Download original image
Continuum-subtracted [CII] spectra (black histograms) as a function of the velocity offset computed with respect to the line peak. The figure shows three different galaxies with no detection of a broad component (left panel), and with individual outflow detection in the case of a single source (middle panel) and a possible merger (right panel). For each galaxy (whose name is reported at the top of the figure), the line profile is fitted with a single Gaussian function (in blue). A double (triple) Gaussian profile (in pink), that is the sum of one (green line) or two (green and grey lines) narrow and a broad (orange line) components, is also shown in the middle and right panels. The FWHM of both components and the corresponding reduced χ2 are reported in each figure. For Mrk1089, FWHMnarrow is obtained from the Gaussian profile resulting from the sum of the two narrow components. The bottom panels display the residuals from the single (blue) and double/triple (pink) Gaussian functions. The dotted horizontal line marks the zero level, while the shaded area represents the rms of each spectrum at ±1σ. Flux densities and residuals are both normalized to the corresponding maximum values.
Current usage metrics show cumulative count of Article Views (full-text article views including HTML views, PDF and ePub downloads, according to the available data) and Abstracts Views on Vision4Press platform.
Data correspond to usage on the plateform after 2015. The current usage metrics is available 48-96 hours after online publication and is updated daily on week days.
Initial download of the metrics may take a while.