Fig. 1.
Download original image
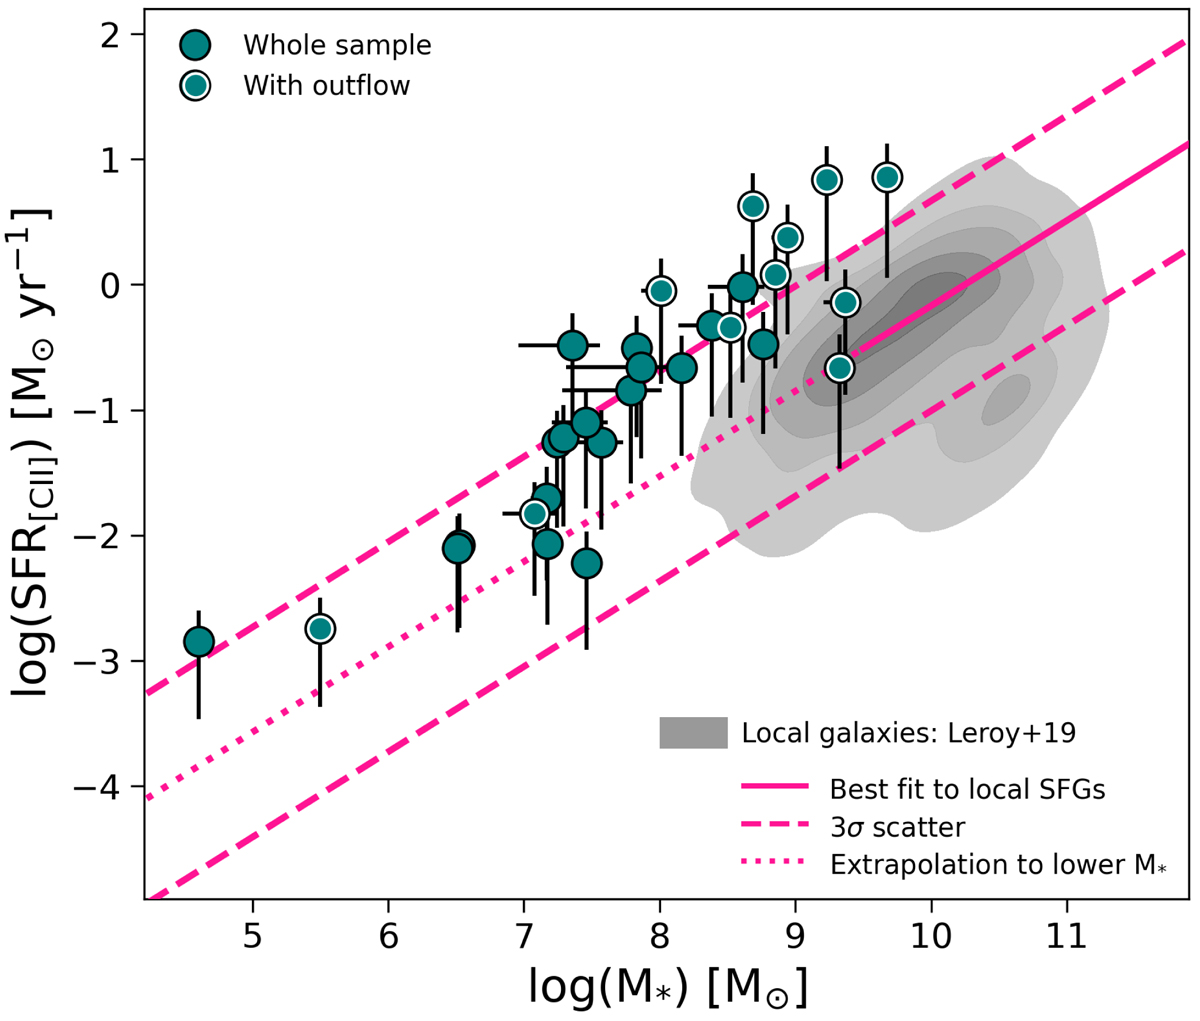
SFR-M* diagram for all the sources in our sample (teal circles). Gray contours show the distribution of nearby galaxies from Leroy et al. (2019). Here, contours increase in steps of 20%, with the lowest one including 90% of the local sample. The pink solid line represents the best-fit relation (by Leroy et al. 2019) to local SFGs (selected in the log(M*/M⊙) = 9.5 − 11 range), probing the local star-forming main sequence. We also show the extrapolation of such a relation to the lower stellar mass regime covered by our galaxy sample (pink dotted line). Pink dashed lines are the 3σ scatter associated with the relation. Circles highlighted in white represent galaxies from our sample with individual outflow detections.
Current usage metrics show cumulative count of Article Views (full-text article views including HTML views, PDF and ePub downloads, according to the available data) and Abstracts Views on Vision4Press platform.
Data correspond to usage on the plateform after 2015. The current usage metrics is available 48-96 hours after online publication and is updated daily on week days.
Initial download of the metrics may take a while.