Fig. 8.
Download original image
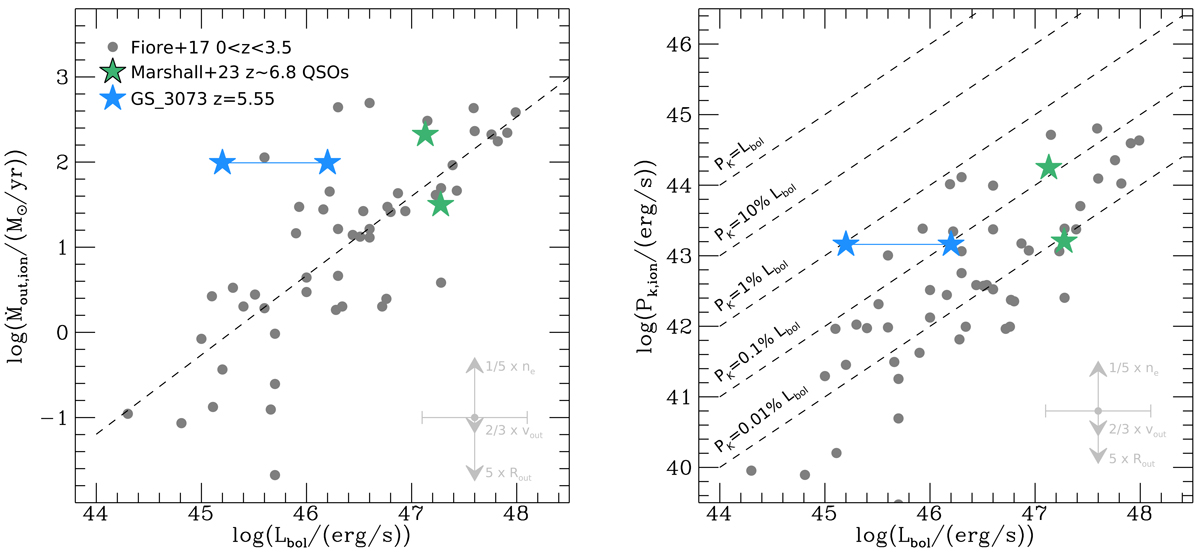
Mass outflow rate Ṁout,ion (left) and kinetic power Pk,ion (right) of the warm ionised gas phase as a function of AGN bolometric luminosity Lbol. The grey circles show ionised gas outflows at 0 < z < 3.5 by Fiore et al. (2017), the green stars show two z ∼ 6.8 QSOs from the GA-IFS GTO programme by Marshall et al. (2023), and the blue stars show the range of bolometric luminosities inferred for GS_3073, as discussed in Sect. 4.1. We have scaled the measurements by Fiore et al. (2017) and Marshall et al. (2023) to correspond to an electron density in the outflow of ne = 1000 cm−3, as assumed in this work. For Lbol, we indicate a representative error bar of 0.5 dex, and for Ṁout,ion and Pk,ion, we indicate how much they would change if ne, Rout, or vout were different by factors 1/5, 5, and 2/3, respectively (see main text for details). The dashed line in the left panel is a linear fit in logarithmic scales to the data by Fiore et al. (2017). The dashed lines in the right panel show constant ratios of Pk and Lbol. The outflow energetics of GS_3073 in relation to the bolometric AGN luminosity are consistent with lower−z scaling relations, suggesting that the driving mechanisms in z > 5 AGN do not differ from their lower−z counterparts.
Current usage metrics show cumulative count of Article Views (full-text article views including HTML views, PDF and ePub downloads, according to the available data) and Abstracts Views on Vision4Press platform.
Data correspond to usage on the plateform after 2015. The current usage metrics is available 48-96 hours after online publication and is updated daily on week days.
Initial download of the metrics may take a while.