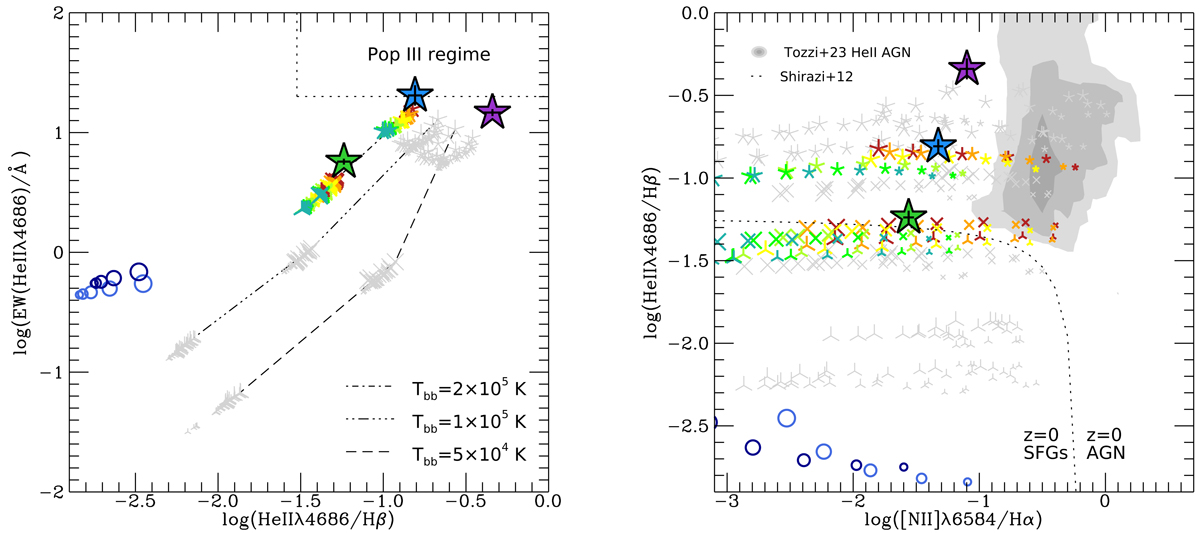
Fig. 7.
Download original image
Diagnostic diagrams of EW(He IIλ4686) versus He IIλ4686/Hβ(left) and He IIλ4686/Hβ versus [N II]λ6584/Hα (right). The symbols are the same as in Fig. 6: Thin stars, crosses, and triangles show evolved AGN and direct collapse black holes; circles show evolved SFGs; and the position of GS_3073 is indicated by the large, filled stars (green: narrow, blue: narrow+outflow, purple: outflow). In the left panel, lines of constant Tbb = 5 × 10⁴ K, 1 × 10⁵ K, 2 × 10⁵ K correspond to dashed, dash-triple-dotted, and dash-dotted lines. In the left panel, the dotted region in the top right indicates the regime expected for Pop III stars. In the right panel, narrow line ratios from local He II-selected AGN by Tozzi et al. (2023) are indicated by the grey shading with contours encompassing 94, 80, and 50 percent of the sample. The dotted line indicates the demarcation by Shirazi & Brinchmann (2012) separating SFGs (left) from AGN (right) at z = 0. In the EW(He IIλ4686) versus He IIλ4686/Hβ diagram, GS_3073 is compatible with an AGN with a hot accretion disc and is clearly separated from SFGs. This is also the case for the He IIλ4686/Hβ versus [N II]λ6584/Hα diagnostic (right), although the locally constrained demarcation line by Shirazi & Brinchmann (2012) appears to evolve with redshift if we consider the location of the model predictions, particularly for AGNs with α = −2.0 (thin triangles).
Current usage metrics show cumulative count of Article Views (full-text article views including HTML views, PDF and ePub downloads, according to the available data) and Abstracts Views on Vision4Press platform.
Data correspond to usage on the plateform after 2015. The current usage metrics is available 48-96 hours after online publication and is updated daily on week days.
Initial download of the metrics may take a while.