Fig. 6.
Download original image
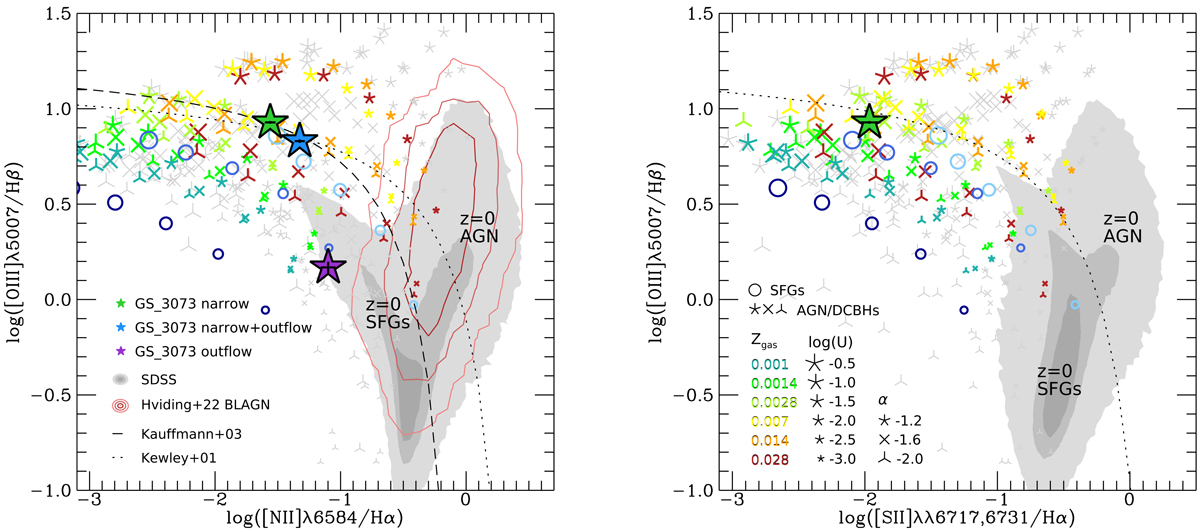
Diagnostic diagrams of [O III]λ5007/Hβ versus [N II]λ6584/Hα (left) and [O III]λ5007/Hβ versus [S II]λλ6717,6731/Hα (right). The position of GS_3073 is indicated with the green, purple, and blue filled stars as constrained by its narrow, outflow, and narrow+outflow line ratios, respectively. Local galaxies from SDSS (Abazajian et al. 2009) are indicated by the grey shading, with the contours encompassing 98, 80, and 50 percent of the sample. The red contours encompass 95, 80, and 50 percent of SDSS broad line AGN as classified by Hviding et al. (2022). The dashed line indicates the demarcation by Kauffmann et al. (2003) between galaxies primarily ionised by SF (left) and AGN (right). The dotted lines by Kewley et al. (2001) include more extreme starbursts or composite objects among the star-forming galaxies to the left. The thin coloured symbols (stars, crosses, triangles) show model grids for AGN and direct collapse black holes by Nakajima & Maiolino (2022) for an accretion disc temperature of Tbb = 2 × 10⁵ K, power law indices constraining the slope between the optical and X-ray bands (α = −1.2, −1.6, −2.0, corresponding to stars, crosses, triangles), ionisation parameters (−3.0 < log U < −0.5, indicated by increasing symbol size), and gas phase metallicities (Zgas = 0.001 − 0.028, teal to red colours). A gas density of 103 cm−3 was assumed. Grey symbols show models with lower Tbb. The open circles show model grids for galaxies using BPASS SEDs (Eldridge et al. 2017; Stanway & Eldridge 2018), with binary evolution based on a Kroupa (2001) initial mass function with an upper mass cut of 300 M⊙ and a stellar age of 10 Myr (see Nakajima & Maiolino 2022 for details). Here, the dark to light colours indicate stellar metallicities in the range Z⋆ = 0.0006 − 0.0084. Compared to these theoretical models, GS_3073 has line ratios compatible with being either a low-metallicity AGN or a low-metallicity SFG, despite being located within the classical SFG regime in the diagrams.
Current usage metrics show cumulative count of Article Views (full-text article views including HTML views, PDF and ePub downloads, according to the available data) and Abstracts Views on Vision4Press platform.
Data correspond to usage on the plateform after 2015. The current usage metrics is available 48-96 hours after online publication and is updated daily on week days.
Initial download of the metrics may take a while.